
 数据结构
数据结构 网络
网络 RDBMS
RDBMS 操作系统
操作系统 Java
Java iOS
iOS HTML
HTML CSS
CSS Android
 Python
 C 编程
C 编程 C++
C++ C#
C# MongoDB
 MySQL
MySQL Javascript
 PHP
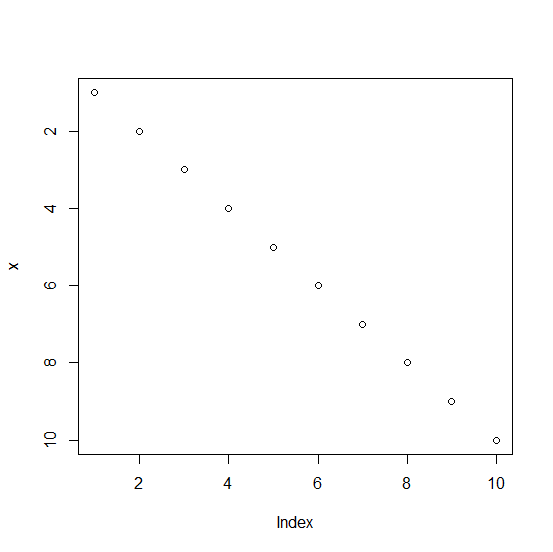
PHP如何在基本 R 中创建一个 Y 轴标签相反的绘图?
要创建 Y 轴标签相反的绘图,我们需要对 Y 轴标签使用 rev 函数与 ylim,但还需要为 Y 轴值定义范围,否则 R 会抛出错误。例如,如果我们有两个名为 x 和 y 的向量,然后可以使用 plot(x,ylim=rev(range(y))) 创建 Y 轴标签相反的绘图。
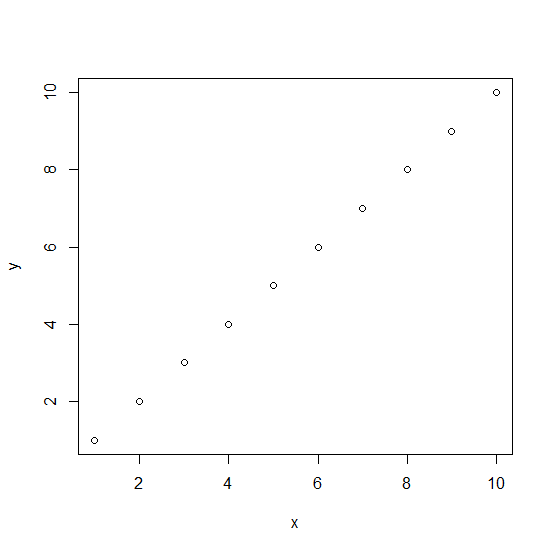
示例
x<-1:10
y<-1:10
plot(x,y)
输出
创建 Y 轴标签相反的绘图 −
示例
plot(x,ylim=rev(range(y)))
输出

更新于: 08-Dec-2020
1K+ 次观看

广告