
 数据结构
数据结构 网络
网络 RDBMS
RDBMS 操作系统
操作系统 Java
Java iOS
iOS HTML
HTML CSS
CSS Android
 Python
 C 编程
C 编程 C++
C++ C#
C# MongoDB
 MySQL
MySQL Javascript
 PHP
PHP如何在 R 中使用 ggplot2 创建的绘图内用盒子高亮显示文本?
可能有多种方法可以突出显示绘图中的文本,但最简单的方法是使用 ggplot2 软件包的 geom_label 函数,借助此函数,我们只需一行代码就可以放置所需的文本及其美观效果。强烈建议您使用 geom_label 函数以及所需规范。
示例
考虑以下数据框 -
set.seed(222)
x<−rnorm(5000,4,1)
df<−data.frame(x)
head(df,20)
输出
   x
1 5.487757
2 3.998108
3 5.381021
4 3.619786
5 4.184136
6 3.753104
7 2.784439
8 5.561405
9 4.427310
10 2.798976
11 5.052458
12 2.694936
13 3.307392
14 4.602649
15 3.802247
16 2.814125
17 1.994487
18 4.007510
19 4.519490
20 3.253705
tail(df,20)
   x
4981 4.555400
4982 5.335003
4983 5.461943
4984 4.026777
4985 4.001629
4986 4.244421
4987 2.711058
4988 5.611044
4989 4.752044
4990 2.988279
4991 4.007473
4992 2.951105
4993 3.981081
4994 5.526550
4995 4.602384
4996 4.908750
4997 3.568487
4998 3.276785
4999 4.303017
5000 2.663639
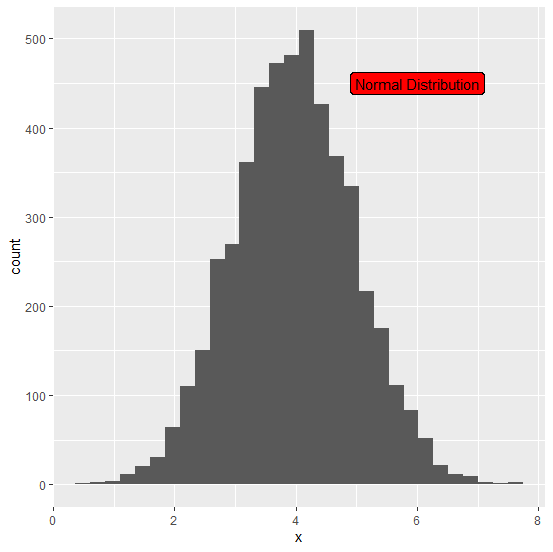
加载 ggplot2 软件包并在绘图中突出显示文本来创建 x 的直方图 -
library(ggplot2)
ggplot(df,aes(x))+geom_histogram(bins=30)+geom_label(aes(x=6,y=450,label="Normal Distribution"),fill="red")
输出

更新于: 06-Nov-2020
208 次浏览

广告