
 Data Structure
 Networking
 RDBMS
RDBMS Operating System
 Java
Java MS Excel
 iOS
iOS HTML
HTML CSS
CSS Android
 Python
 C Programming
 C++
C++ C#
C# MongoDB
 MySQL
MySQL Javascript
 PHP
PHP
- Selected Reading
- UPSC IAS Exams Notes
- Developer's Best Practices
- Questions and Answers
- Effective Resume Writing
- HR Interview Questions
- Computer Glossary
- Who is Who
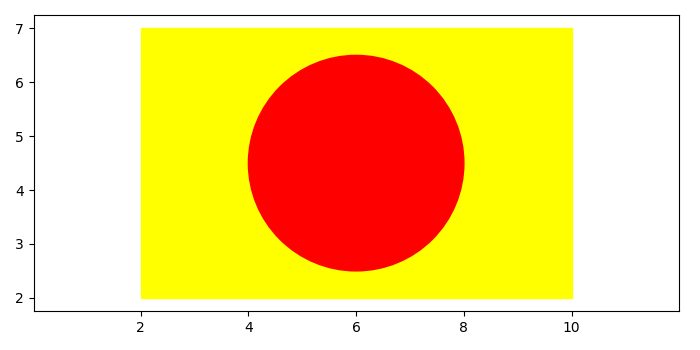
Plot a Circle Inside a Rectangle in Matplotlib
To place a circle inside a rectangle, we can take the following steps −
Create a new figure or activate an existing figure using figure() method.
Add a subplot to the current axis.
Create a rectangle and a circle instance.
Add a rectangle patch to the current axis.
Add a circle patch to the current axis.
Scale x and y axes using xlim() and ylim() methods.
To display the figure, use show() method.
Example
import matplotlib
from matplotlib import pyplot as plt, patches
plt.rcParams["figure.figsize"] = [7.00, 3.50]
plt.rcParams["figure.autolayout"] = True
fig = plt.figure()
ax = fig.add_subplot(111)
rect = patches.Rectangle((2, 2), 8, 5, color='yellow')
circle = patches.Circle((6, 4.5), radius=2, color='red')
ax.add_patch(rect)
ax.add_patch(circle)
plt.xlim([-10, 10])
plt.ylim([-10, 10])
plt.axis('equal')
plt.show()
Output

Updated on: 2021-05-12T11:44:02+05:30
1K+ Views

Advertisements