
 数据结构
数据结构 网络
网络 关系数据库管理系统(RDBMS)
 操作系统
操作系统 Java
Java iOS
iOS HTML
HTML CSS
CSS Android
 Python
 C语言编程
C语言编程 C++
C++ C#
C# MongoDB
 MySQL
MySQL Javascript
 PHP
PHP如何使用TensorFlow和预训练模型来理解学习曲线?
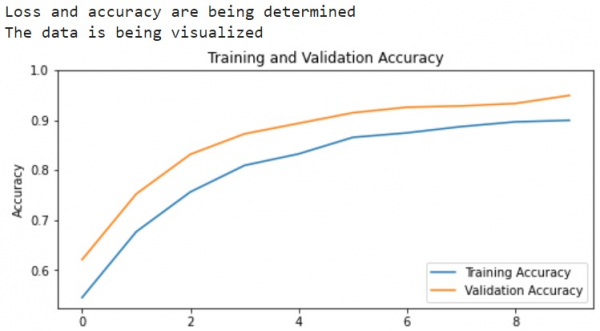
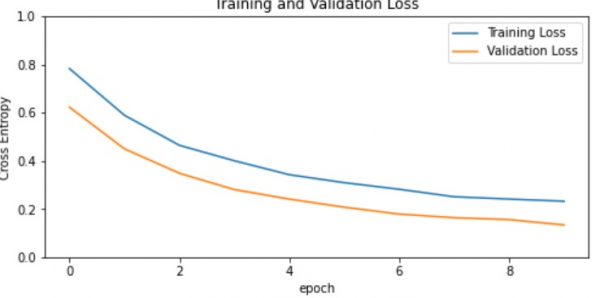
TensorFlow和预训练模型可以通过可视化对输入数据集执行的操作来理解学习曲线。训练精度和验证精度借助于'matplotlib'库绘制出来。训练损失和验证损失也同样可视化。
阅读更多: 什么是TensorFlow以及Keras如何与TensorFlow一起创建神经网络?
包含至少一层卷积层的神经网络被称为卷积神经网络。我们可以使用卷积神经网络来构建学习模型。
我们将了解如何借助于来自预训练网络的迁移学习来对猫和狗的图像进行分类。图像分类中迁移学习背后的直觉是,如果一个模型在大型通用数据集上进行训练,则此模型可以有效地用作视觉世界的通用模型。它已经学习了特征图,这意味着用户不必从头开始在一个大型数据集上训练大型模型。
阅读更多: 如何预训练自定义模型?
我们正在使用Google Colaboratory来运行以下代码。Google Colab或Colaboratory帮助在浏览器上运行Python代码,无需任何配置,并且可以免费访问GPU(图形处理单元)。Colaboratory构建在Jupyter Notebook之上。
示例
print("Loss and accuracy are being determined")
acc = history.history['accuracy']
val_acc = history.history['val_accuracy']
loss = history.history['loss']
val_loss = history.history['val_loss']
print("The data is being visualized")
plt.figure(figsize=(8, 8))
plt.subplot(2, 1, 1)
plt.plot(acc, label='Training Accuracy')
plt.plot(val_acc, label='Validation Accuracy')
plt.legend(loc='lower right')
plt.ylabel('Accuracy')
plt.ylim([min(plt.ylim()),1])
plt.title('Training and Validation Accuracy')
plt.subplot(2, 1, 2)
plt.plot(loss, label='Training Loss')
plt.plot(val_loss, label='Validation Loss')
plt.legend(loc='upper right')
plt.ylabel('Cross Entropy')
plt.ylim([0,1.0])
plt.title('Training and Validation Loss')
plt.xlabel('epoch')
plt.show()
代码来源 −https://tensorflowcn.cn/tutorials/images/transfer_learning
输出
Explore our latest online courses and learn new skills at your own pace. Enroll and become a certified expert to boost your career.
解释
训练和验证精度/损失的学习曲线被可视化。
这是使用MobileNet V2基本模型作为固定的特征提取器完成的。

更新于: 2021年2月25日
232 次浏览

广告