如何在 Seaborn 中调整绘图的大小?
绘图的大小指的是其宽度和高度,单位可以是英寸或厘米。通过调整绘图的大小,我们可以控制它在屏幕上或打印介质中占据的空间。Seaborn 提供了多种修改绘图大小以满足我们需求的选项。
Seaborn 的 API 中没有名为“figure size”的特定参数。当使用 Seaborn 创建绘图时,我们可以通过使用 Matplotlib 的函数或参数直接操作 Figure 对象来指定绘图的大小。
导入所需的库
在继续使用这些方法之前,我们必须确保所需的库已安装在我们的 Python 工作环境中。安装完成后,我们必须使用以下代码行导入它们。
import seaborn as sns
import matplotlib.pyplot as plt
在 seaborn 中调整绘图大小有多种方法。让我们详细了解每种方法。
使用 Matplotlib 的 Figure 调整大小
Seaborn 绘图是使用 Matplotlib 的 Figure 和 Axes 对象创建的。要调整绘图的大小,我们可以直接操作 Figure 对象。
示例
在此示例中,我们使用 'plt.figure(figsize=(8, 6))' 创建一个宽度为 8 英寸,高度为 6 英寸的 Figure 对象。这将设置绘图所需的大小。
import seaborn as sns
import matplotlib.pyplot as plt
# Create a figure with a specific size
plt.figure(figsize=(8, 6))
x = [1,22,10]
y = [4,56,67]
# Create a plot using Seaborn
sns.scatterplot(x)
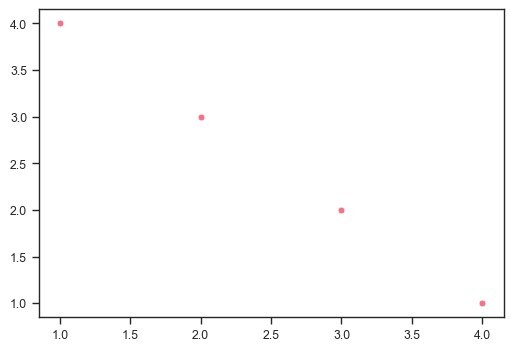
plt.show()
输出
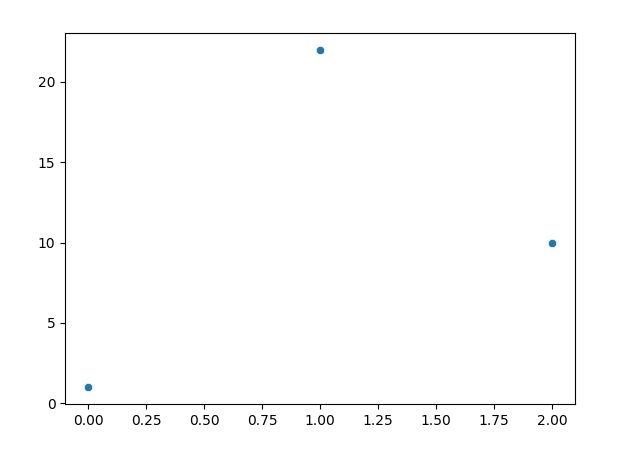
使用 Seaborn 的函数调整大小
Seaborn 提供了一个名为 'set_context()' 的便捷函数,它允许我们调整绘图的整体样式,包括大小。'set_context()' 函数有一个名为 'rc' 的参数,它接受一个 Matplotlib 参数字典。我们可以使用 'figure.figsize' 参数指定绘图的大小。
示例
在此示例中,我们使用 'sns.set_context("paper", rc={"figure.figsize": (8, 6)})' 将绘图上下文设置为“paper”,并将所需大小指定为 (8, 6) 英寸。之后创建的绘图将反映此更新的上下文。
import seaborn as sns
import matplotlib.pyplot as plt
# Create a figure with a specific size
plt.figure(figsize=(8, 6))
x = [1,22,10]
y = [4,56,67]
# Create a plot using Seaborn
sns.scatterplot(x)
# Set the context with a specific size
sns.set_context("paper", rc={"figure.figsize": (8, 6)})
# Create a plot using Seaborn
sns.scatterplot(x=x)
plt.show()
输出
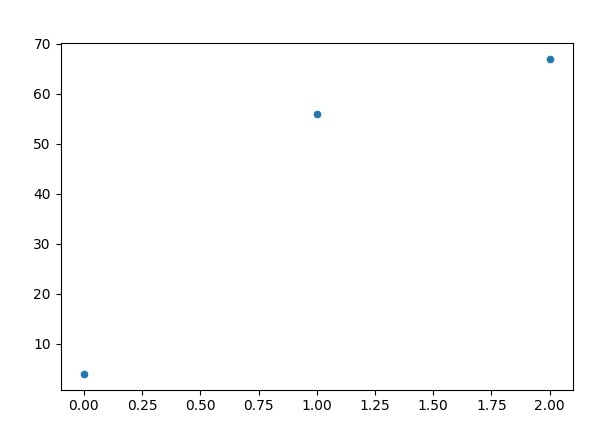
使用 Matplotlib 的 rcParams 调整大小
Matplotlib 有一组称为 'rcParams' 的全局参数,它们控制绘图外观的各个方面。我们可以修改 'rcParams' 中的 'figure.figsize' 参数以调整 Seaborn 中绘图的大小。
示例
在此示例中,'plt.rcParams["figure.figsize"] = (8, 6)' 将全局参数 'figure.figsize' 设置为 (8, 6) 英寸,这会影响随后使用 Seaborn 创建的绘图的大小。
import seaborn as sns
import matplotlib.pyplot as plt
# Create a figure with a specific size
plt.figure(figsize=(3, 3))
y = [4,56,67]
# Create a plot using Seaborn
sns.scatterplot(y)
# Set the figure size using rcParams
plt.rcParams["figure.figsize"] = (600, 400)
# Create a plot using Seaborn
sns.scatterplot(y=y)
plt.show()
输出
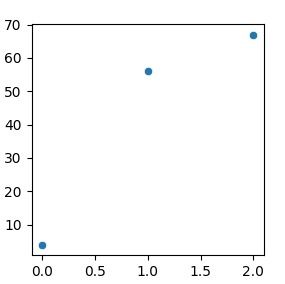
调整子图的大小
如果我们在一个图形中有多个子图,我们可以使用 Matplotlib 中的 'subplots()' 函数控制它们各自的大小。
示例
在此示例中,我们使用 'fig, axes = plt.subplots(2, 2, figsize=(10, 8))' 创建一个具有 2x2 子图网格的图形。'figsize' 参数指定图形的整体大小,而各个子图可以通过 'axes' 对象访问并分配特定的绘图。
# Create a figure with multiple subplots
fig, axes = plt.subplots(2, 2, figsize=(10, 8))
# Create plots using Seaborn
sns.scatterplot(x=x, y=y, ax=axes[0, 0])
sns.histplot(data=x, ax=axes[0, 1])
sns.lineplot(data=y, ax=axes[1, 0])
sns.boxplot(data=y, ax=axes[1, 1])
plt.show()
输出
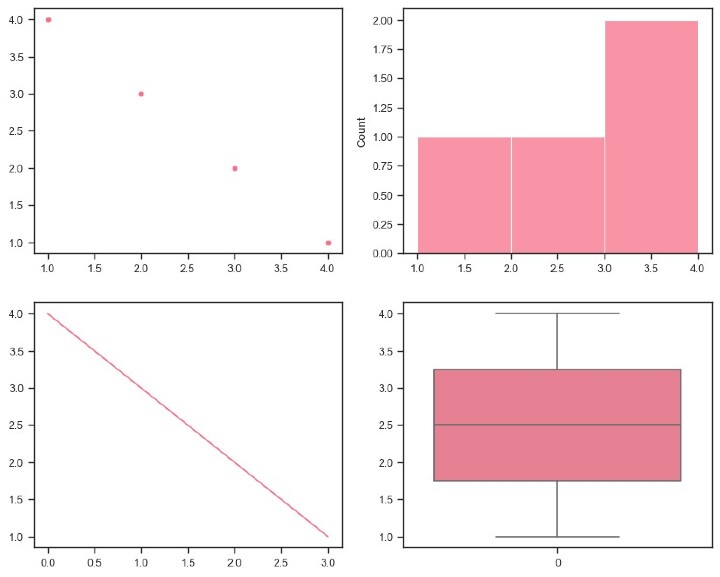
保存具有所需大小的绘图
调整完绘图的大小后,我们可以使用 Matplotlib 的 'savefig()' 函数将其保存到文件中,确保保存的绘图保留所需的大小。
示例
在此示例中 'plt.savefig("output.png", dpi=100, bbox_inches="tight")' 用于将绘图保存为图像文件。'dpi' 参数指定分辨率,'bbox_inches="tight"' 确保保存的绘图包含整个图形,而不会裁剪任何部分。
# Set the figure size
plt.figure(figsize=(6, 4))
# Create a plot using Seaborn
sns.scatterplot(x=x, y=y)
# Save the plot with desired size
plt.savefig("output.png", dpi=100, bbox_inches="tight")
plt.show()
输出


 数据结构
数据结构 网络
网络 关系数据库管理系统
 操作系统
操作系统 Java
Java iOS
iOS HTML
HTML CSS
CSS Android
 Python
 C 编程
C 编程 C++
C++ C#
C# MongoDB
 MySQL
MySQL Javascript
 PHP
PHP