
 数据结构
数据结构 网络
网络 RDBMS
RDBMS 操作系统
操作系统 Java
Java iOS
iOS HTML
HTML CSS
CSS Android
 Python
 C 编程
C 编程 C++
C++ C#
C# MongoDB
 MySQL
MySQL Javascript
 PHP
PHP如何利用 matplotlib.pyplot 更改表格的字号?
要使用 matplotlib 更改表格的字体大小,我们可以使用 set_fontsize() 方法。
步骤
- 创建一个图形和一组子图,nrows=1 和 ncols=1。
- 使用 numpy 创建随机数据。
- 创建 columns 参数。
- 让坐标轴 tight 和 off。
- 初始化变量 fontsize 以更改字体大小。
- 使用 set_font_size() 方法设置表格的字体大小。
- 要显示图形,使用 show() 方法。
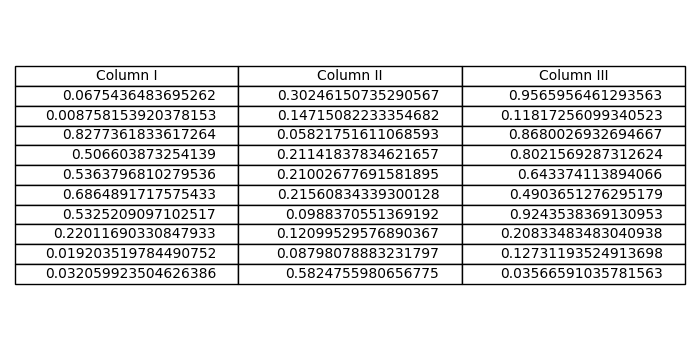
示例
import numpy as np
from matplotlib import pyplot as plt
plt.rcParams["figure.figsize"] = [7.00, 3.50]
plt.rcParams["figure.autolayout"] = True
fig, axs = plt.subplots(1, 1)
data = np.random.random((10, 3))
columns = ("Column I", "Column II", "Column III")
axs.axis('tight')
axs.axis('off')
the_table = axs.table(cellText=data, colLabels=columns, loc='center')
the_table.auto_set_font_size(False)
the_table.set_fontsize(10)
plt.show()
输出

更新于: 15-05-2021
7000+ 浏览量

广告