
 数据结构
数据结构 网络
网络 关系型数据库管理系统 (RDBMS)
 操作系统
操作系统 Java
Java iOS
iOS HTML
HTML CSS
CSS Android
 Python
 C语言编程
C语言编程 C++
C++ C#
C# MongoDB
 MySQL
MySQL Javascript
 PHP
PHP如何在R中使用ggplot2创建的点图中更改点的尺寸?
要更改使用ggplot2创建的点图中点的尺寸,我们可以在`geom_dotplot`中使用`binwidth`参数。例如,如果我们有一个名为df的数据框,其中包含一个我们要为其创建点图的列x,那么可以使用命令`ggplot(df,aes(x))+geom_dotplot(binwidth=2)`创建具有不同点尺寸的图。
示例
考虑以下数据框:
x<-rpois(20,5)
df<-data.frame(x)
df
输出
   x
1  1
2  3
3  6
4  3
5  5
6  11
7  2
8  3
9  2
10 6
11 5
12 4
13 4
14 6
15 8
16 6
17 8
18 9
19 4
20 7
加载ggplot2包并为df中的数据创建一个具有不同点尺寸的点图:
示例
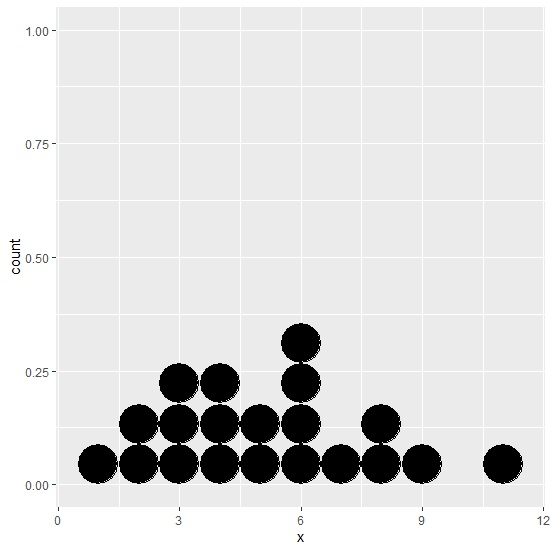
library(ggplot2)
ggplot(df,aes(x))+geom_dotplot(binwidth=1)
输出
示例
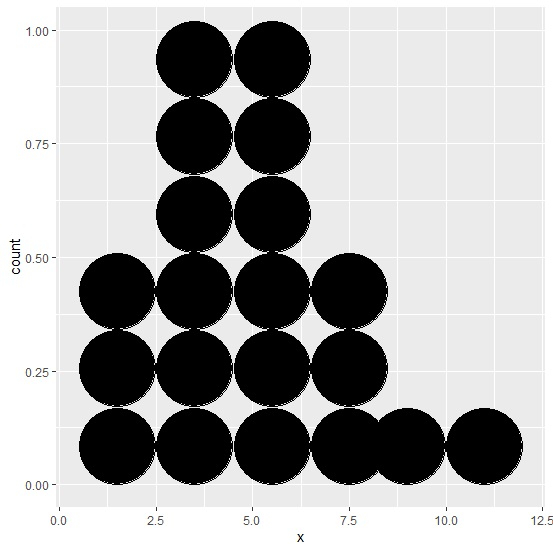
ggplot(df,aes(x))+geom_dotplot(binwidth=0.5)
输出

示例
ggplot(df,aes(x))+geom_dotplot(binwidth=2)
输出

更新于:2021年3月6日
2K+ 次浏览

广告