
 数据结构
数据结构 网络
网络 关系型数据库管理系统
 操作系统
操作系统 Java
Java iOS
iOS HTML
HTML CSS
CSS Android
 Python
 C 编程
C 编程 C++
C++ C#
C# MongoDB
 MySQL
MySQL Javascript
 PHP
PHP如何在 OpenCV Python 中计算和绘制图像的二维直方图?
我们可以应用cv2.calcHist()函数来计算图像的二维直方图。彩色图像具有三个通道 - 红色、绿色和蓝色。我们可以一次计算两个颜色通道的二维直方图。因此,我们有三种颜色通道组合,每次取两个 - 红色和绿色(或绿色和红色)、绿色和蓝色(或蓝色和绿色)以及蓝色和红色(或红色和蓝色)。
步骤
要计算和绘制输入图像的二维直方图,可以按照以下步骤操作 -
导入所需的库OpenCV和matplotlib。确保您已安装它们。
使用cv2.imread()方法读取输入图像。指定图像的完整路径。
使用cv2.split()函数将输入图像拆分为相应的蓝色、绿色和红色通道。
blue, green, red = cv2.split(img)
一次计算两个颜色通道的二维彩色直方图。计算三个颜色通道所有三种组合的二维直方图。要计算绿色和蓝色通道的二维直方图,我们应用以下代码片段。
hist = cv2.calcHist([green, blue], [0, 1], None, [32, 32],[0, 256, 0, 256])
绘制上面计算出的二维直方图。
让我们看一些例子,以便更好地理解这个问题。
我们在下面的示例中使用以下图像作为输入文件。
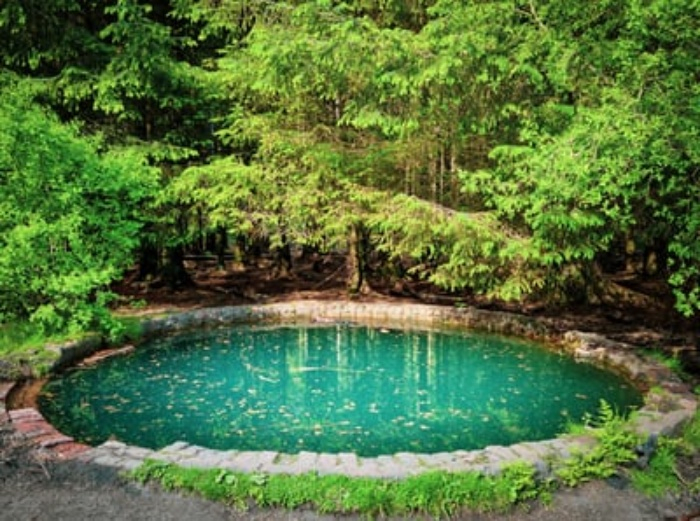
示例
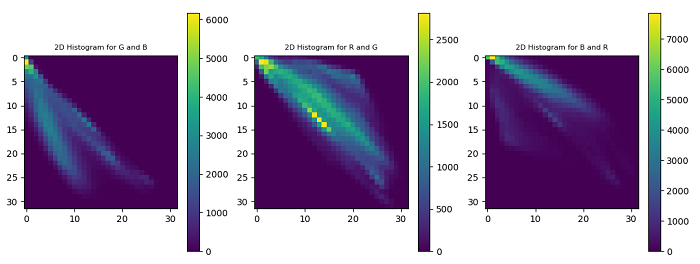
在这个 Python 程序中,我们计算并绘制输入图像的三种组合(蓝色和绿色、绿色和红色以及红色和蓝色)颜色的二维直方图。
# import required libraries
import cv2
from matplotlib import pyplot as plt

# Read the input image
img = cv2.imread('blue-pool.jpg')

# split the image into the respective channels Blue, Green and Red
blue, green, red = cv2.split(img)

# 2D color histogram for the

# green and blue channels
plt.subplot(131)
hist1 = cv2.calcHist([green, blue], [0, 1], None, [32, 32],[0, 256, 0, 256])
p = plt.imshow(hist1, interpolation="nearest")
plt.title("2D Histogram for G and B", fontsize=8)
plt.colorbar(p)

# 2D color histogram for the red and green channels
plt.subplot(132)
hist2 = cv2.calcHist([red, green], [0, 1], None, [32, 32],[0, 256, 0, 256])
p = plt.imshow(hist2, interpolation="nearest")
plt.title("2D Histogram for R and G", fontsize=8)
plt.colorbar(p)

# 2D color histogram for the blue and red channels
plt.subplot(133)
hist3 = cv2.calcHist([blue, red], [0, 1], None, [32, 32],[0, 256, 0, 256])
p = plt.imshow(hist3, interpolation="nearest")
plt.title("2D Histogram for B and R", fontsize=8)
plt.colorbar(p)
plt.show()
运行上述程序时,将生成以下输出窗口,显示输入图像的二维直方图。

更新于: 2022年12月2日
664 次浏览

广告