
 数据结构
数据结构 网络
网络 RDBMS
RDBMS 操作系统
操作系统 Java
Java iOS
iOS HTML
HTML CSS
CSS Android
 Python
 C 编程
C 编程 C++
C++ C#
C# MongoDB
 MySQL
MySQL Javascript
 PHP
PHP如何计算 PyTorch 中张量的直方图?
使用 torch.histc() 计算张量的直方图。它返回一个表示为张量的直方图。它使用四个参数:input、bins、min 和 max。它将元素排序到 min 和 max 之间的相等宽度箱中。它忽略小于 min 和大于 max 的元素。
步骤
导入所需的库。在所有以下 Python 示例中,所需的 Python 库都是 torch 和 Matplotlib。确保已经安装了它们。
创建一个张量并打印它。
计算 torch.histc(input, bins=100, min=0, max=100)。它将返回一个直方图值张量。根据需要将 bins、min 和 max 设置为适当的值。
打印上面计算的直方图。
将直方图作为条形图进行可视化。
示例 1
# Python program to calculate histogram of a tensor
# import necessary libraries
import torch
import matplotlib.pyplot as plt

# Create a tensor
T = torch.Tensor([2,3,1,2,3,4,3,2,3,4,3,4])
print("Original Tensor T:\n",T)

# Calculate the histogram of the above created tensor
hist = torch.histc(T, bins = 5, min = 0, max = 4)
print("Histogram of T:\n", hist)
输出
Original Tensor T:
   tensor([2., 3., 1., 2., 3., 4., 3., 2., 3., 4., 3., 4.])
Histogram of T:
   tensor([0., 1., 3., 5., 3.])
示例 2
# Python program to calculate histogram of a tensor
# import necessary libraries
import torch
import matplotlib.pyplot as plt
# Create a tensor
T = torch.Tensor([2,3,1,2,3,4,3,2,3,4,3,4])
print("Original Tensor T:\n",T)
# Calculate the histogram of the above created tensor
hist = torch.histc(T, bins = 5, min = 0, max = 4)
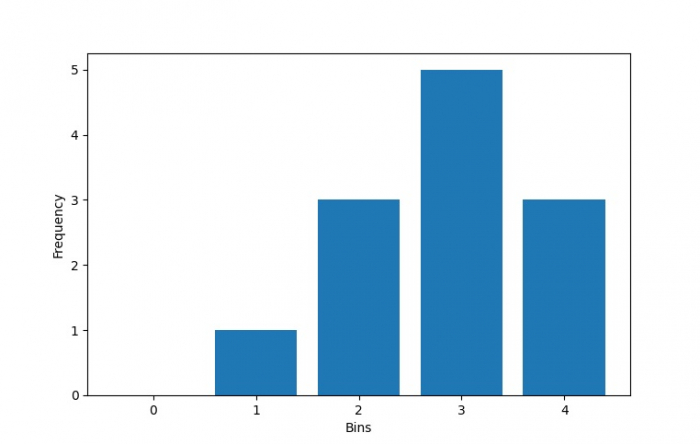
# Visualize above calculated histogram as bar diagram
bins = 5
x = range(bins)
plt.bar(x, hist, align='center')
plt.xlabel('Bins')
plt.ylabel('Frequency')
plt.show()输出
Original Tensor T:
   tensor([2., 3., 1., 2., 3., 4., 3., 2., 3., 4., 3., 4.])

更新时间:2021 年 11 月 6 日
1 千次浏览

广告