
 数据结构
数据结构 网络
网络 RDBMS
RDBMS 操作系统
操作系统 Java
Java iOS
iOS HTML
HTML CSS
CSS Android
 Python
 C 编程
C 编程 C++
C++ C#
C# MongoDB
 MySQL
MySQL Javascript
 PHP
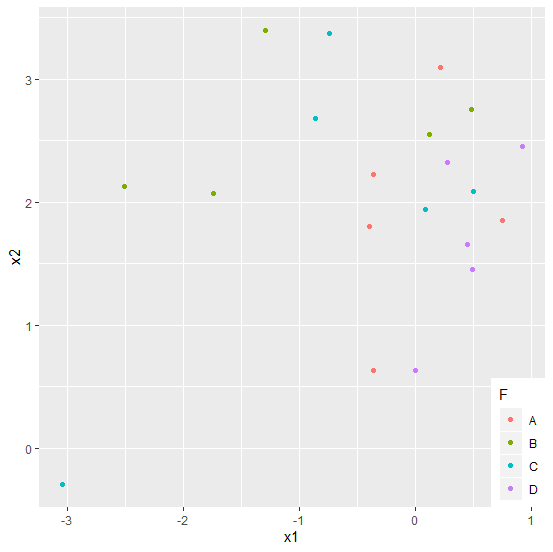
PHP如何使用 ggplot2 在 R 中创建具有图例位置位于绘图区域内的散点图?
图例有助于我们在创建散点图时区分响应变量的值。借助这种方式,我们可以了解一个因子变量级别如何影响响应变量。图例通常位于左下角、右上角、左上角和右下角。我们可以使用 theme 函数来设置图例的位置。
示例
考虑下方数据框 −
> set.seed(99)
> x1<-rnorm(20)
> x2<-rnorm(20,2)
> F<-factor(c("A","B","C","D"))
> df<-data.frame(x1,x2,F)
> library(ggplot2)
使用不同的图例位置创建绘图 −
考虑下方数据框 −
> ggplot(df, aes(x=x1, y=x2, colour=F)) + geom_point(aes(colour=F)) +
+ theme(legend.justification = c(1, 0), legend.position = c(1, 0))
输出
> ggplot(df, aes(x=x1, y=x2, colour=F)) + geom_point(aes(colour=F)) +
+ theme(legend.justification = c(1, 1), legend.position = c(1, 1))
输出

> ggplot(df, aes(x=x1, y=x2, colour=F)) + geom_point(aes(colour=F)) +
+ theme(legend.justification = c(0, 1), legend.position = c(0, 1))
输出

> ggplot(df, aes(x=x1, y=x2, colour=F)) + geom_point(aes(colour=F)) +
+ theme(legend.justification = c(0, 0), legend.position = c(0, 0))
输出


更新日期:2020-08-12
242 次浏览

广告