
 数据结构
数据结构 网络
网络 RDBMS
RDBMS 操作系统
操作系统 Java
Java iOS
iOS HTML
HTML CSS
CSS 安卓
安卓 Python
 C编程
C编程 C++
C++ C#
C# MongoDB
 MySQL
MySQL Javascript
 PHP
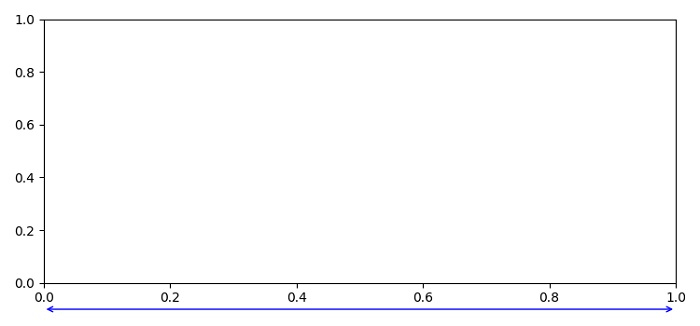
PHP如何绘制超出matplotlib中轴范围的线?
要绘制超出轴范围的线(即箭头),可以使用annotate()方法,
步骤
设置图形大小并调整子图之间的填充和周围的填充。
使用figure()方法创建一个新图或激活现有图。
清除当前图。
使用add_subplot()方法将'~.axes.Axes'作为子图排列的一部分添加到图中。
使用annotate()方法放置轴外的线。
要显示图形,请使用show()方法。
示例
import matplotlib.pyplot as plt

plt.rcParams["figure.figsize"] = [7.50, 3.50]
plt.rcParams["figure.autolayout"] = True

fig = plt.figure(1)
fig.clf()

ax = fig.add_subplot(1, 1, 1)
ax.annotate('', xy=(0, -0.1), xycoords='axes fraction', xytext=(1, -0.1),
arrowprops=dict(arrowstyle="<->", color='b'))
plt.show()
输出

更新于:04-6月-2021
超过 2 千次查看

广告