
 数据结构
数据结构 网络
网络 关系数据库管理系统
 操作系统
操作系统 Java
Java iOS
iOS HTML
HTML CSS
CSS Android
 Python
 C 编程
C 编程 C++
C++ C#
C# MongoDB
 MySQL
MySQL Javascript
 PHP
PHP在 matplotlib 中,n、bins 和 patches 是什么?
hist() 方法在 matplotlib 中返回 n、bins 和 patches。如果有多个输入数据集,Patches 是用于创建直方图的各个 artists 的容器,或此类容器的列表。Bins 定义了范围内等宽度的 bin 数量。
让我们举个例子来了解其工作原理。
步骤
设置图形大小并调整子图之间和周围的边距。
使用 numpy 创建随机数据点。
绘制一个包含 100 个 bin 的直方图。
设置一个 artist 对象上的属性。
使用 show() 方法显示图形。
示例
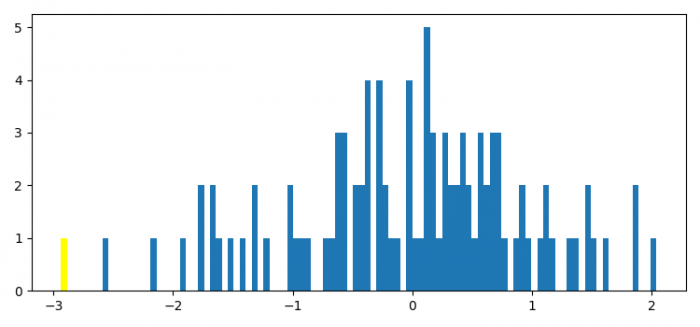
import numpy as np
import matplotlib.pyplot as plt

plt.rcParams["figure.figsize"] = [7.50, 3.50]
plt.rcParams["figure.autolayout"] = True

x = np.random.normal(size=100)

n, bins, patches = plt.hist(x, bins=100)

plt.setp(patches[0], 'facecolor', 'yellow')

plt.show()
输出

更新于: 2021-08-09
2K+ 次浏览

广告