
 数据结构
数据结构 联网
联网 RDBMS
RDBMS 操作系统
操作系统 Java
Java iOS
iOS HTML
HTML CSS
CSS Android
 Python
 C 编程
C 编程 C++
C++ C#
C# MongoDB
 MySQL
MySQL JavaScript
 PHP
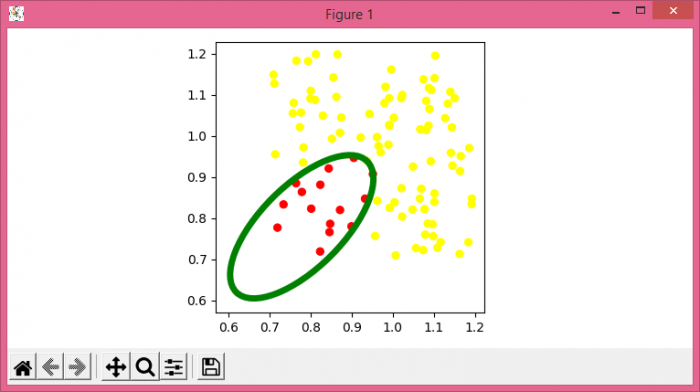
PHP比 contains_point 方法更快地检查点是否在椭圆内(Matplotlib)
若要比 contains_point 方法更快地检查点是否在椭圆内,我们可以采取以下步骤:
- 设置图形大小并调整子图之间和周围的填充。
- 创建一个图形和一组子图。
- 将纵横比设置为相等。
- 使用 numpy 创建 x 和 y 数据点。
- 初始化椭圆的中心、高度、宽度和角度。
- 获得一个无比例椭圆。
- 将“~.Patch”添加到轴修补程序;返回修补程序。
- 如果点位于椭圆内,则将其颜色更改为“红色”,否则更改为“绿色”。
- 使用**scatter()**方法绘制带有颜色的 x 和 y 数据点。
- 若要显示图形,请使用**show()**方法。
示例
import matplotlib.pyplot as plt
import matplotlib.patches as patches
import numpy as np

plt.rcParams["figure.figsize"] = [7.50, 3.50]
plt.rcParams["figure.autolayout"] = True

fig, ax = plt.subplots(1)
ax.set_aspect('equal')

x = np.random.rand(100) * 0.5 + 0.7
y = np.random.rand(100) * 0.5 + 0.7

center = (0.7789, 0.7789)
width = 0.45
height = 0.20
angle = 45.
ecl = patches.Ellipse(center, width, height, angle=angle,
fill=False, edgecolor='green', linewidth=5)
ax.add_patch(ecl)

cosine = np.cos(np.radians(180. - angle))
sine = np.sin(np.radians(180. - angle))

xc = x - center[0]
yc = y - center[1]

xct = xc * cosine - yc * sine
yct = xc * sine + yc * cosine

rad_cc = (xct ** 2 / (width / 2.) ** 2) + (yct ** 2 / (height / 2.) ** 2)
colors = np.array(['yellow'] * len(rad_cc))
colors[np.where(rad_cc <=)[0]] = 'red'

ax.scatter(x, y, c=colors, linewidths=0.7)

plt.show()
输出


更新于:03-Aug-2021
479 次浏览

广告