如何使用 TensorFlow 实现逻辑回归?
TensorFlow 是 Google 提供的一个机器学习框架。它是一个开源框架,与 Python 结合使用以实现算法、深度学习应用程序等等。它用于研究和生产目的。它具有优化技术,有助于快速执行复杂的数学运算。这是因为它使用了 NumPy 和多维数组。
多维数组也称为“张量”。该框架支持使用深度神经网络。它具有高度可扩展性,并附带许多流行的数据集。它使用 GPU 计算并自动管理资源。
可以使用以下代码行在 Windows 上安装“tensorflow”包:
pip install tensorflow
张量是 TensorFlow 中使用的一种数据结构。它有助于连接数据流图中的边。此数据流图称为“数据流图”。张量只不过是多维数组或列表。
MNIST 数据集包含手写数字,其中 60000 个用于训练模型,10000 个用于测试训练后的模型。这些数字已进行大小归一化和居中处理,以适应固定大小的图像。

以下是一个示例:
示例
from __future__ import absolute_import, division, print_function
import tensorflow as tf
import numpy as np
num_classes = 10
num_features = 784
learning_rate = 0.01
training_steps = 1000
batch_size = 256
display_step = 50
from tensorflow.keras.datasets import mnist
(x_train, y_train), (x_test, y_test) = mnist.load_data()
x_train, x_test = np.array(x_train, np.float32), np.array(x_test, np.float32)
x_train, x_test = x_train.reshape([-1, num_features]), x_test.reshape([−1, num_features])
x_train, x_test = x_train / 255., x_test / 255.
train_data = tf.data.Dataset.from_tensor_slices((x_train, y_train))
train_data = train_data.repeat().shuffle(5000).batch(batch_size).prefetch(1)
A = tf.Variable(tf.ones([num_features, num_classes]), name="weight")
b = tf.Variable(tf.zeros([num_classes]), name="bias")
def logistic_reg(x):
   return tf.nn.softmax(tf.matmul(x, A) + b)
def cross_entropy(y_pred, y_true):
   y_true = tf.one_hot(y_true, depth=num_classes)
   y_pred = tf.clip_by_value(y_pred, 1e−9, 1.)
   return tf.reduce_mean(−tf.reduce_sum(y_true * tf.math.log(y_pred),1))
def accuracy_val(y_pred, y_true):
   correct_prediction = tf.equal(tf.argmax(y_pred, 1), tf.cast(y_true, tf.int64))
   return tf.reduce_mean(tf.cast(correct_prediction, tf.float32))
   optimizer = tf.optimizers.SGD(learning_rate)
def run_optimization(x, y):
   with tf.GradientTape() as g:
      pred = logistic_reg(x)
      loss = cross_entropy(pred, y)
      gradients = g.gradient(loss, [A, b])
      optimizer.apply_gradients(zip(gradients, [A, b]))
      for step, (batch_x, batch_y) in enumerate(train_data.take(training_steps), 1):
         run_optimization(batch_x, batch_y)
         if step % display_step == 0:
            pred = logistic_regression(batch_x)
            loss = cross_entropy(pred, batch_y)
            acc = accuracy_val(pred, batch_y)
            print("step: %i, loss: %f, accuracy: %f" % (step, loss, acc))
pred = logistic_reg(x_test)
print("Test accuracy is : %f" % accuracy_val(pred, y_test))
import matplotlib.pyplot as plt
n_images = 4
test_images = x_test[:n_images]
predictions = logistic_reg(test_images)
for i in range(n_images):
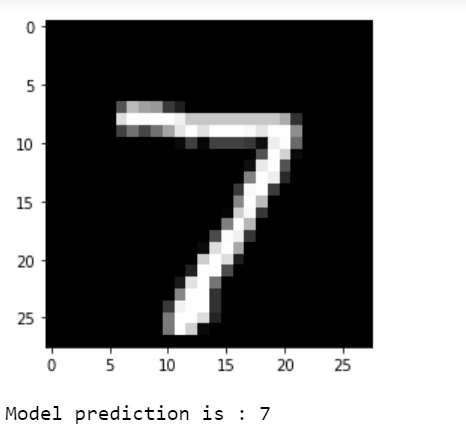
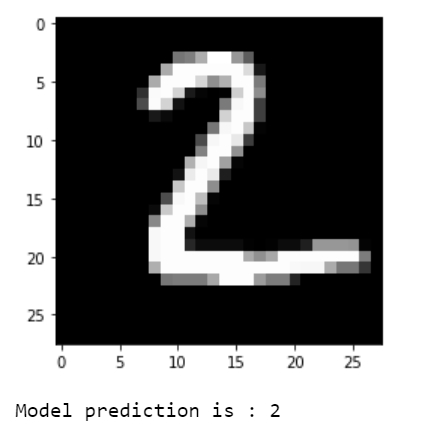
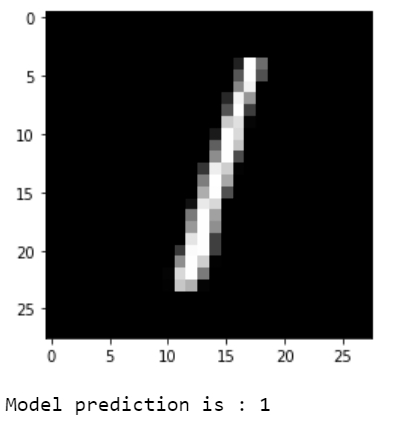
   plt.imshow(np.reshape(test_images[i], [28, 28]), cmap='gray')
   plt.show()
print("Model prediction is : %i" % np.argmax(predictions.numpy()[i]))输出
step: 50, loss: 2.301992, accuracy: 0.132812
step: 100, loss: 2.301754, accuracy: 0.125000
step: 150, loss: 2.303200, accuracy: 0.117188
step: 200, loss: 2.302409, accuracy: 0.117188
step: 250, loss: 2.303324, accuracy: 0.101562
step: 300, loss: 2.301391, accuracy: 0.113281
step: 350, loss: 2.299984, accuracy: 0.140625
step: 400, loss: 2.303896, accuracy: 0.093750
step: 450, loss: 2.303662, accuracy: 0.093750
step: 500, loss: 2.297976, accuracy: 0.148438
step: 550, loss: 2.300465, accuracy: 0.121094
step: 600, loss: 2.299437, accuracy: 0.140625
step: 650, loss: 2.299458, accuracy: 0.128906
step: 700, loss: 2.302172, accuracy: 0.117188
step: 750, loss: 2.306451, accuracy: 0.101562
step: 800, loss: 2.303451, accuracy: 0.109375
step: 850, loss: 2.303128, accuracy: 0.132812
step: 900, loss: 2.307874, accuracy: 0.089844
step: 950, loss: 2.309694, accuracy: 0.082031
step: 1000, loss: 2.302263, accuracy: 0.097656
Test accuracy is : 0.869700


解释
导入并为所需的包设置别名。
定义 MNIST 数据集的学习参数。
从源加载 MNIST 数据集。
将数据集拆分为训练数据集和测试数据集。数据集中的图像被展平为具有 28 x 28 = 784 个特征的一维向量。
图像值被归一化到 [0,1] 而不是 [0,255]。
定义了一个名为“logistic_reg”的函数,该函数给出输入数据的 softmax 值。它将 logits 归一化为概率分布。
定义交叉熵损失函数,它将标签编码为独热向量。预测值被格式化以减少 log(0) 错误。
需要计算准确性指标,因此定义了一个函数。
定义随机梯度下降优化器。
定义了一个用于优化的函数,该函数计算梯度并更新权重和偏差的值。
对数据进行指定步数的训练。
在验证集上测试构建的模型。
可视化预测结果。

广告

 数据结构
数据结构 网络
网络 关系型数据库管理系统 (RDBMS)
 操作系统
操作系统 Java
Java iOS
iOS HTML
HTML CSS
CSS Android
 Python
 C语言编程
C语言编程 C++
C++ C#
C# MongoDB
 MySQL
MySQL Javascript
 PHP
PHP