
 数据结构
数据结构 网络
网络 关系数据库管理系统 (RDBMS)
 操作系统
操作系统 Java
Java iOS
iOS HTML
HTML CSS
CSS Android
 Python
 C语言编程
C语言编程 C++
C++ C#
C# MongoDB
 MySQL
MySQL Javascript
 PHP
PHP如何在R的ggplot2中将条形图的X轴标签转换为斜体?
显然,与其他任何统计分析工具一样,R中轴标签的默认字体不是斜体,但我们可以使用ggplot2来实现。为此,我们可以使用ggplot2包的theme函数,其中我们可以使用axis.text.x参数更改轴标签的字体。
示例
考虑以下数据框
> x<-c("A","B","C","D")
> y<-c(24,23,25,27)
> df<-data.frame(x,y)
> df
输出
  x  y
1 A 24
2 B 23
3 C 25
4 D 27
加载ggplot2包并创建条形图
示例
> library(ggplot2)
> ggplot(df,aes(x,y))+geom_bar(stat="identity")
输出

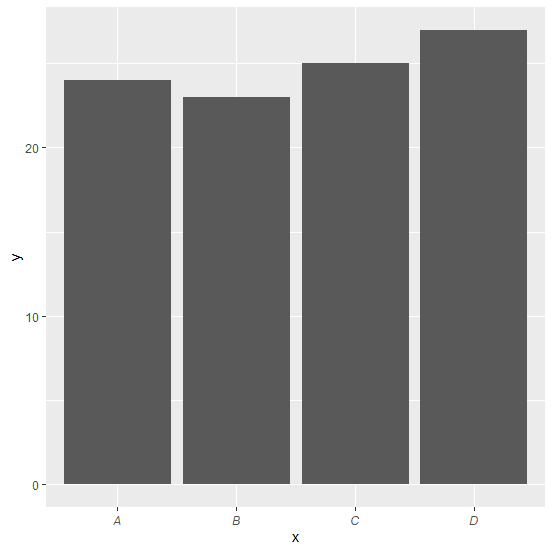
创建带有斜体X轴标签的条形图
示例
> ggplot(df,aes(x,y))+geom_bar(stat="identity")+theme(axis.text.x=element_text(face=c("italic","italic","italic","italic")))
Warning message:
Vectorized input to `element_text()` is not officially supported.
Results may be unexpected or may change in future versions of ggplot2.
此警告消息不会影响图表,但它有助于我们理解ggplot2的未来版本可能不支持element_text内的矢量化输入。
输出

更新于:2020年11月19日
837 次浏览

广告