
 数据结构
数据结构 网络
网络 RDBMS
RDBMS 操作系统
操作系统 Java
Java iOS
iOS HTML
HTML CSS
CSS Android
 Python
 C 编程
C 编程 C++
C++ C#
C# MongoDB
 MySQL
MySQL Javascript
 PHP
PHP如何在 R 中使用权重创建直方图?
使用权重的直方图表示值的加权分布。在 R 中,我们可以使用 plotrix 包的 weighted.hist 函数创建这种类型的直方图,并且我们只需要每个值对应的值和权重。由于 plotrix 不常用,因此我们必须确保使用 install.packages("plotrix") 安装此包,然后在 R 环境中加载它。
加载 plotrix 包 -
library("plotrix")考虑下面的向量和与该向量相关的权重 -
示例
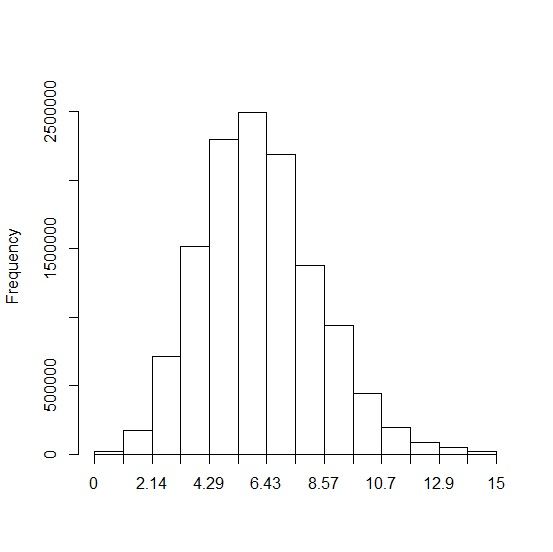
x<-sort(rpois(5000,5))
weight<-seq(1,5000)
为 x 创建加权直方图 -
输出
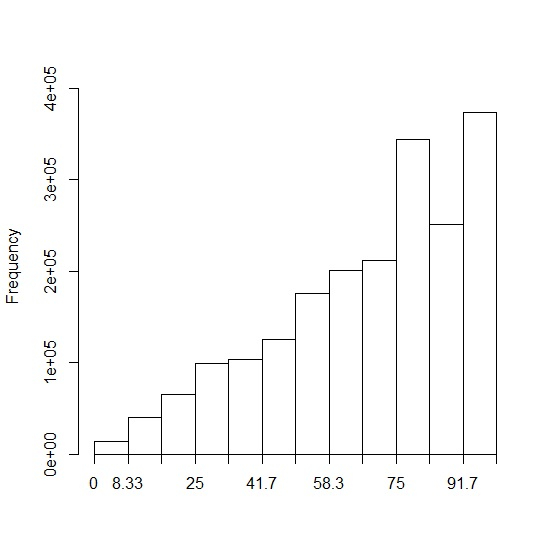
我们来看另一个示例 -
示例
y<-sort(sample(0:100,2000,replace=TRUE))
weight<-seq(1,2000) \
weighted.hist(y,weight)
输出

更新于:2020-10-10
1K+ 浏览量

广告