
 数据结构
数据结构 网络
网络 RDBMS
RDBMS 操作系统
操作系统 Java
Java iOS
iOS HTML
HTML CSS
CSS Android
 Python
 C编程
C编程 C++
C++ C#
C# MongoDB
 MySQL
MySQL Javascript
 PHP
PHP如何使用R中的ggplot2创建具有空点的点图?
点图可以通过使用geom_point 函数创建,如果我们想为单个向量创建点图,那么我们应该在aes函数中的两个位置传递向量。此外,默认情况下,点是完整的黑圆圈,如果我们想将点更改为空点,则可以使用shape参数。
示例
考虑下面的数据框 -
set.seed(171)
x<−rnorm(20,1,0.04)
df<−data.frame(x)
df
输出
x
1 0.9608285
2 1.0077832
3 1.0420915
4 0.9526998
5 1.0423519
6 1.0023625
7 0.9184376
8 1.0215420
9 1.0841583
10 1.0164277
11 1.0215934
12 0.9135340
13 0.9975233
14 1.0626451
15 1.0335912
16 1.0702276
17 0.9642820
18 1.0088072
19 0.9794760
20 0.9665569
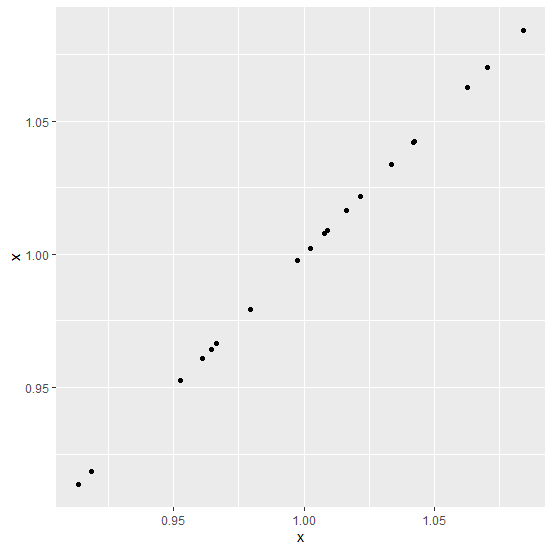
加载ggplot2包并创建点图 -
library(ggplot2)
ggplot(df,aes(x,x))+geom_point()
输出
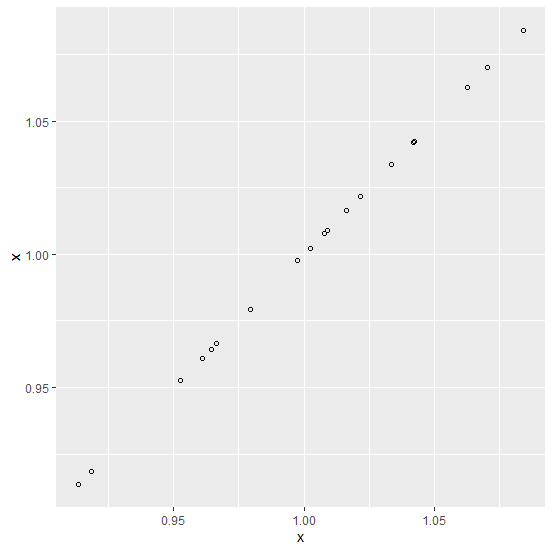
使用空点创建点图 -
ggplot(df,aes(x,x))+geom_point(shape=1)
输出
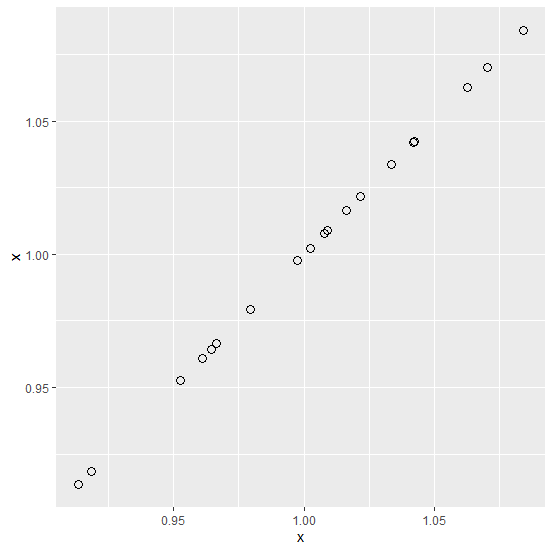
使用空点和更大尺寸创建点图 -
ggplot(df,aes(x,x))+geom_point(shape=1,size=3)
输出

更新于: 2020年10月17日
3K+次浏览

广告