
 数据结构
数据结构 网络
网络 关系数据库管理系统 (RDBMS)
 操作系统
操作系统 Java
Java iOS
iOS HTML
HTML CSS
CSS Android
 Python
 C语言编程
C语言编程 C++
C++ C#
C# MongoDB
 MySQL
MySQL Javascript
 PHP
PHP如何在Android中创建分组条形图?
信息可视化是现代移动应用程序中一个重要的组成部分,它允许用户快速直观地理解复杂数据。条形图是一种常用的数据可视化方法,用于比较不同类别或分组中的数据。在本文中,我们将学习如何使用著名的MPAndroidChart库在Android中创建分组条形图。MPAndroidChart库提供了一套全面的实用程序和自定义选项,用于在Android应用程序中创建交互性和视觉吸引力强的图表。通过使用这个库,您可以轻松地创建分组条形图,它以离散分组显示数据,以便于比较和分析。
使用的方法
MPAndroidChart库方法
MPAndroidChart库方法
算法
导入必要的类和库 −
来自MPAndroidChart库的BarChart
BarEntry、BarDataSet和BarData用于数据表示
颜色,用于设置条形分组的颜色
设置布局 −
创建一个包含BarChart视图的布局XML文件来显示图表。
初始化条形图 −
在activity的onCreate方法中,使用其在布局中的ID查找条形图。
配置条形图的任何必要属性,例如网格背景、轴标签或图例。
准备数据 −
创建BarEntry对象来表示每一组条形的数据。
将BarEntry对象分组到单独的列表中,每个列表代表一个不同的组。
自定义每个组的外观 −
为每一组条形创建BarDataSet对象。
使用setColor方法设置每个条形数据集的所需颜色。
创建图表数据 −
创建一个IBarDataSet对象的列表,添加每一组的BarDataSet对象。
使用IBarDataSet对象的列表创建一个BarData对象。
设置图表数据如下 −
使用setData方法将BarData对象设置为BarChart。
刷新图表 −
调用条形图上的invalidate方法来刷新其外观并显示图表。
XML程序
<?xml version="1.0" encoding="utf-8"?>
<RelativeLayout
	xmlns:android="http://schemas.android.com/apk/res/android"
	xmlns:tools="http://schemas.android.com/tools"
	android:layout_width="match_parent"
	android:layout_height="match_parent"
	tools:context=".MainActivity">

	<!--Ui component for our bar chart-->
	<com.github.mikephil.charting.charts.BarChart
		android:id="@+id/idBarChart"
		android:layout_width="match_parent"
		android:layout_height="match_parent" />

</RelativeLayout>
Java程序
import android.graphics.Color;
import android.os.Bundle;

import androidx.appcompat.app.AppCompatActivity;

import com.github.mikephil.charting.charts.BarChart;
import com.github.mikephil.charting.components.XAxis;
import com.github.mikephil.charting.data.BarData;
import com.github.mikephil.charting.data.BarDataSet;
import com.github.mikephil.charting.data.BarEntry;
import com.github.mikephil.charting.formatter.IndexAxisValueFormatter;

import java.util.ArrayList;

public class MainActivity extends AppCompatActivity {

   // Variable for the bar chart
   BarChart barChart;

   // Variables for bar data sets
   BarDataSet barDataSet1, barDataSet2;

   // ArrayList for storing entries
   ArrayList<BarEntry> barEntries;

   // Creating a string array for displaying days
   String[] days = new String[]{"Sunday", "Monday", "Tuesday", "Wednesday", "Thursday", "Friday", "Saturday"};

   @Override
   protected void onCreate(Bundle savedInstanceState) {
      super.onCreate(savedInstanceState);
      setContentView(R.layout.activity_main);

      // Initializing the variable for the bar chart
      barChart = findViewById(R.id.idBarChart);

      // Creating a new bar data set
      barDataSet1 = new BarDataSet(getBarEntriesOne(), "First Set");
      barDataSet1.setColor(getApplicationContext().getResources().getColor(R.color.purple_200));
      barDataSet2 = new BarDataSet(getBarEntriesTwo(), "Second Set");
      barDataSet2.setColor(Color.BLUE);

      // Adding bar data sets to the bar data
      BarData data = new BarData(barDataSet1, barDataSet2);

      // Setting the data to the bar chart
      barChart.setData(data);

      // Removing the description label of the bar chart
      barChart.getDescription().setEnabled(false);

      // Getting the x-axis of the bar chart
      XAxis xAxis = barChart.getXAxis();

      // Setting value formatter to the x-axis
      // and adding the days to the x-axis labels
      xAxis.setValueFormatter(new IndexAxisValueFormatter(days));

      // Setting center axis labels for the bar chart
      xAxis.setCenterAxisLabels(true);

      // Setting the position of the x-axis to bottom
      xAxis.setPosition(XAxis.XAxisPosition.BOTTOM);

      // Setting granularity for the x-axis labels
      xAxis.setGranularity(1);

      // Enabling granularity for the x-axis
      xAxis.setGranularityEnabled(true);

      // Making the bar chart draggable
      barChart.setDragEnabled(true);

      // Setting the visible range for the bar chart
      barChart.setVisibleXRangeMaximum(3);

      // Adding bar space to the chart
      float barSpace = 0.1f;

      // Adding group spacing to the chart
      float groupSpace = 0.5f;

      // Setting the width of the bars
      data.setBarWidth(0.15f);

      // Setting the minimum axis value for the chart
      barChart.getXAxis().setAxisMinimum(0);

      // Animating the chart
      barChart.animate();

      // Grouping bars and adding spacing to them
      barChart.groupBars(0, groupSpace, barSpace);

      // Invalidating the bar chart
      barChart.invalidate();
   }

   // ArrayList for the first set of bar entries
   private ArrayList<BarEntry> getBarEntriesOne() {
      // Creating a new ArrayList
      barEntries = new ArrayList<>();

      // Adding entries to the ArrayList for the first set
      barEntries.add(new BarEntry(1f, 4));
      barEntries.add(new BarEntry(2f, 6));
      barEntries.add(new BarEntry(3f, 8));
      barEntries.add(new BarEntry(4f, 2));
      barEntries.add(new BarEntry(5f, 4));
      barEntries.add(new BarEntry(6f, 1));

      return barEntries;
   }

   // ArrayList for the second set of bar entries
   private ArrayList<BarEntry> getBarEntriesTwo() {
      // Creating a new ArrayList
      barEntries = new ArrayList<>();

      // Adding entries to the ArrayList for the second set
      barEntries.add(new BarEntry(1f, 8));
      barEntries.add(new BarEntry(2f, 12));
      barEntries.add(new BarEntry(3f, 4));
      barEntries.add(new BarEntry(4f, 1));
      barEntries.add(new BarEntry(5f, 7));
      barEntries.add(new BarEntry(6f, 3));

      return barEntries;
   }
}
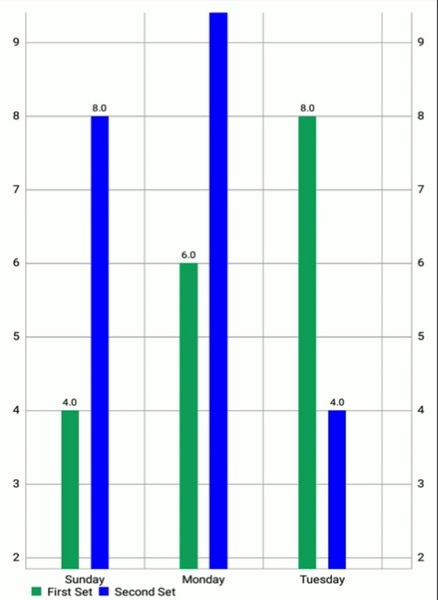
输出
结论
在本教程中,我们介绍了使用MPAndroidChart库创建分组条形图所需的步骤。我们讨论了如何初始化BarChart,如何通过为每个组生成BarEntry对象来准备数据,以及如何使用BarDataSet对象自定义每个组的外观。然后,我们介绍了如何通过将BarDataSet对象合并到BarData对象中并将其分配给BarChart来创建图表数据。此外,我们强调了刷新图表以反映数据中任何更改的重要性,并提供了使用invalidate方法执行此操作的说明。

597 次浏览
