
 数据结构
数据结构 网络
网络 关系型数据库管理系统
 操作系统
操作系统 Java
Java iOS
iOS HTML
HTML CSS
CSS Android
 Python
 C 语言编程
 C++
C++ C#
C# MongoDB
 MySQL
MySQL Javascript
 PHP
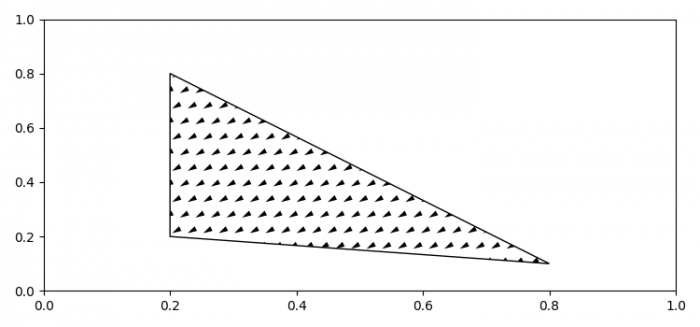
PHP如何在 Matplotlib 中使用自定义阴影填充多边形?
若要在 matplotlib 中使用自定义阴影填充多边形,我们可以覆盖 matplotlib.hatch.Shapes 类。
步骤
- 设置图像尺寸并调整子图之间和周围的填充。
- 使用 polygon 类创建阴影形状并获取路径。
- 覆盖具有 shape_vertices, shape_codes, 等形状的自定义阴影形状类。
- 创建新图像或激活现有图像。
- 将一个轴添加到图像,作为子图排列的一部分。
- 添加形状为 polygon 的轴补丁。
- 设置阴影图案。
- 要显示图像,请使用 show() 方法。
示例
import matplotlib.hatch
import matplotlib.pyplot as plt
from matplotlib.patches import Polygon

plt.rcParams["figure.figsize"] = [7.50, 3.50]
plt.rcParams["figure.autolayout"] = True

my_hatch_shape = Polygon(
   [[0., 0.4], [-0.3, 0.1], [0.1, 0.2]],
   closed=True, fill=False).get_path()

class MyCustomHatch(matplotlib.hatch.Shapes):
   filled = True
   size = 1.0
   path = my_hatch_shape

   def __init__(self, hatch, density):
      self.num_rows = (hatch.count('c')) * density
      self.shape_vertices = self.path.vertices
      self.shape_codes = self.path.codes
      matplotlib.hatch.Shapes.__init__(self, hatch, density)

matplotlib.hatch._hatch_types.append(MyCustomHatch)

fig = plt.figure()
ax = fig.add_subplot(111)

pg = ax.add_patch(Polygon(
   [[0.2, 0.2], [0.2, 0.8], [0.8, 0.1]],
   closed=True, fill=False))

pg.set_hatch('c')

plt.show()
输出

更新于: 07-7-2021
902 次浏览

广告