如何使用Python Scikit-Learn生成对称正定矩阵?
Python Scikit-learn 提供了 `make_spd_matrix()` 函数,借助该函数我们可以生成随机对称正定矩阵。在本教程中,我们将使用 Python 中的 Scikit-learn (Sklearn) 生成对称正定矩阵和稀疏 spd 矩阵。
为此,我们可以遵循以下步骤:
步骤 1 − 导入必要的库:`sklearn.datasets.make_spd_matrix`、`matplotlib` 和 `seaborn`。
步骤 2 − 创建 `make_spd_matrix()` 的对象,并提供 `n_dim` 参数的值,该参数表示矩阵维度。
步骤 3 − 使用 matplotlib 库设置输出图形的大小。
步骤 4 − 使用 seaborn 库将矩阵绘制为颜色编码方案。
示例
# Importing libraries
from sklearn.datasets import make_spd_matrix
from matplotlib import pyplot as plt
from matplotlib import style
import seaborn as sns

# Set the figure size
plt.rcParams["figure.figsize"] = [7.16, 3.50]
plt.rcParams["figure.autolayout"] = True
plt.show()

# Creating and plotting Sparse Positive-Definite matrix of dimension 4
style.use("ggplot")

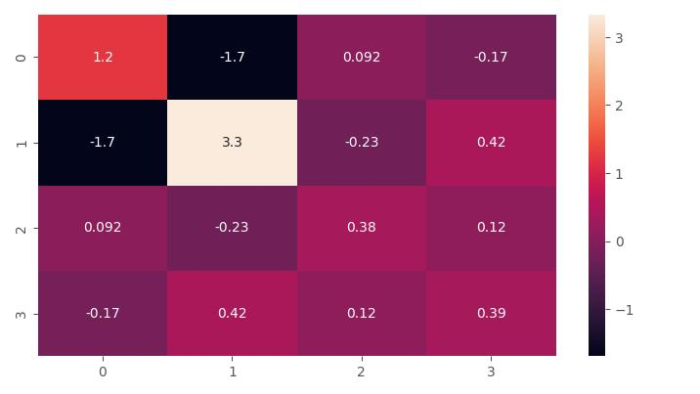
spd = make_spd_matrix(n_dim=4, random_state=1)
sns.heatmap(data=spd, annot=True, cmap='rocket')
plt.show()
输出
它将产生以下输出

示例
检查上面生成的稀疏正定矩阵的值:
import pandas as pd
from sklearn.datasets import make_spd_matrix
spd = make_spd_matrix(n_dim=4, random_state=1)
print(pd.DataFrame(spd))
输出
它将产生以下输出
      0           1        2           3
0   1.214261  -1.693503   0.092278  -0.167397
1  -1.693503   3.331807  -0.230052   0.424357
2   0.092278  -0.230052   0.381256   0.119570
3  -0.167397   0.424357   0.119570   0.387159
生成稀疏 spd 矩阵
Python Scikit-learn 提供了 `make_sparse_spd_matrix()` 函数,借助该函数我们可以生成稀疏对称正定 (spd) 矩阵。
为了生成它并在三维空间中绘制它,我们可以遵循以下步骤:
步骤 1 − 导入必要的库:`sklearn.datasets.make_sparse_spd_matrix()` 和 `matplotlib`。
步骤 2 − 提供样本数量和其他参数。
步骤 3 − 使用 NumPy 创建一个随机数组。此数组应与在 `sklearn.datasets.make_sparse_spd_matrix()` 函数中提供的元素数量相同。
步骤 4 − 使用 matplotlib 库设置输出图形的大小和样式。
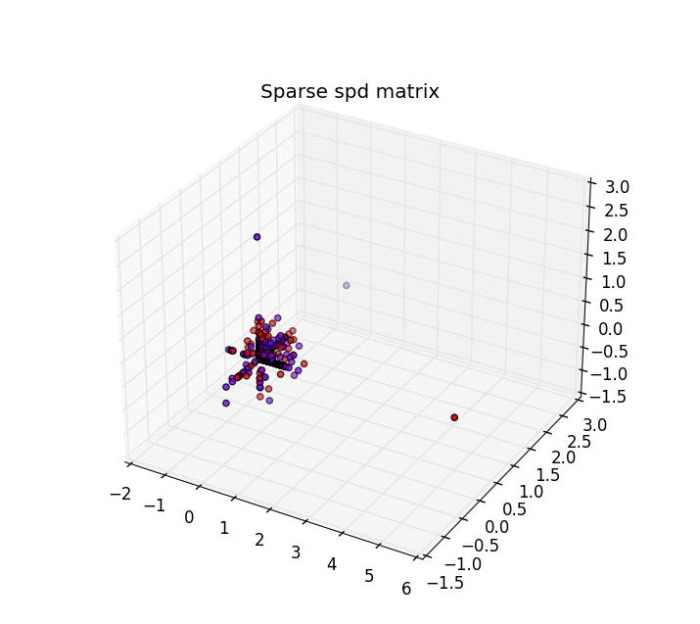
步骤 5 − 使用 matplotlib 构造一个 3D 图表以说明稀疏 spd 矩阵。
示例
在下面的示例中,我们将生成具有 500 个样本的稀疏 spd 矩阵。
# Importing libraries
from sklearn.datasets import make_sparse_spd_matrix
import numpy as np
import matplotlib.pyplot as plt
import matplotlib.style
import matplotlib as mpl
mpl.style.use('classic')
from mpl_toolkits.mplot3d import Axes3D

# Creating Sparse spd matrix
X= make_sparse_spd_matrix(dim=500, random_state=0)

#Creating a random array 'y'(it's not sparse)
from numpy import random
y=random.randint(2, size=(500))

# Plotting the sparse spd matrix in 3-dimensional
figure_3D = plt.figure(figsize=(7.50,3.50))
plt.subplots_adjust(bottom=0.05, top=0.9, left=0.05, right=0.95)
ax = figure_3D.add_subplot(111, projection='3d')
ax.scatter(X[:, 0], X[:, 1], X[:, 2], c=y, cmap=plt.cm.rainbow)
plt.title('Sparse spd matrix')
plt.show()
输出
它将产生以下输出:


 数据结构
数据结构 网络
网络 关系数据库管理系统 (RDBMS)
 操作系统
操作系统 Java
Java iOS
iOS HTML
HTML CSS
CSS Android
 Python
 C语言编程
C语言编程 C++
C++ C#
C# MongoDB
 MySQL
MySQL Javascript
 PHP
PHP