
 数据结构
数据结构 网络
网络 RDBMS
RDBMS 操作系统
操作系统 Java
Java iOS
iOS HTML
HTML CSS
CSS 安卓
安卓 Python
 C 编程
C 编程 C++
C++ C#
C# MongoDB
 MySQL
MySQL Javascript
 PHP
PHP如何在 Seaborn 点图上获取数据标签?
若要在 Seaborn 点图上获取数据标签,我们可以采取以下步骤 −
步骤
设置图形大小,并调整子图之间和周围的填充。
创建一个 df 数据框,该数据框是二维的、可变大小的、潜在的异构表格数据。
创建一个点图。
获取轴补丁和标签;用各个标签注释。
若要显示图形,可以使用 show() 方法。
示例
from matplotlib import pyplot as plt
import pandas as pd
import seaborn as sns
plt.rcParams["figure.figsize"] = [7.50, 3.50]
plt.rcParams["figure.autolayout"] = True
df = pd.DataFrame({'a': [1, 3, 1, 2, 3, 1]})
ax = sns.pointplot(df["a"],
order=df["a"].value_counts().index)
for p, label in zip(ax.patches, df["a"].value_counts().index):
ax.annotate(label, (p.get_x() + 0.375, p.get_height() + 0.15))
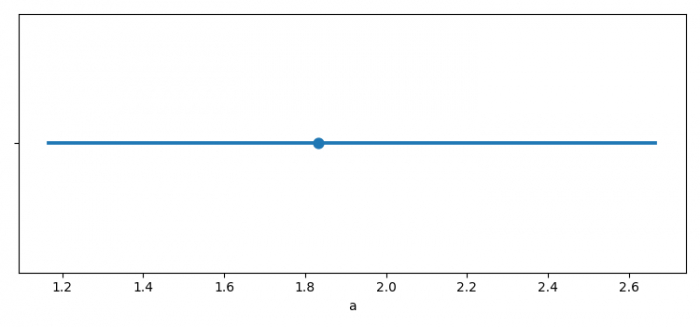
plt.show()输出
它将生成以下输出 −

更新日期:02-02-2022
3K+ 浏览

广告