
 数据结构
数据结构 网络
网络 关系型数据库管理系统
 操作系统
操作系统 Java
Java iOS
iOS HTML
HTML CSS
CSS Android
 Python
 C 编程
C 编程 C++
C++ C#
C# MongoDB
 MySQL
MySQL Javascript
 PHP
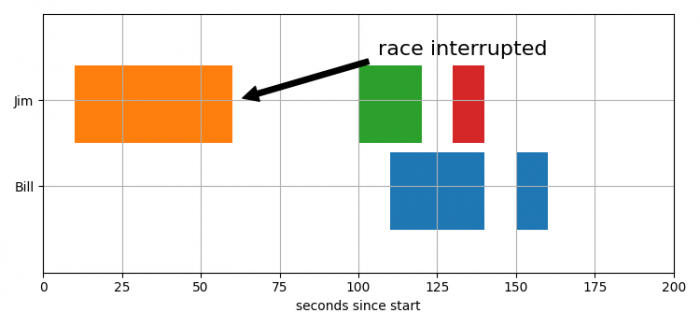
PHP如何在 Matplotlib 中绘制断裂的水平条形图?
我们可以采取以下步骤绘制断裂的条形图,
- 设置图表大小并调整子图之间和周围的间距。
- 创建一个图形和一组子图。
- 绘制水平矩形序列。
- 设置 **x** 和 **y** 轴刻度、X 轴标签、Y 轴刻度和 Y 轴刻度标签。
- 配置网格线。
- 使用 **annotate()** 方法显示文本,该文本可以引用特定位置。
- 要显示图表,请使用 **show()** 方法。
例子
import matplotlib.pyplot as plt

plt.rcParams["figure.figsize"] = [7.50, 3.50]
plt.rcParams["figure.autolayout"] = True

fig, ax = plt.subplots()

ax.broken_barh([(110, 30), (150, 10)], (10, 9), facecolors='tab:blue')
ax.broken_barh([(10, 50), (100, 20), (130, 10)], (20, 9),
               facecolors=('tab:orange', 'tab:green', 'tab:red'))
ax.set_ylim(5, 35)
ax.set_xlim(0, 200)
ax.set_xlabel('seconds since start')
ax.set_yticks([15, 25])
ax.set_yticklabels(['Bill', 'Jim'])
ax.grid(True)

ax.annotate('race interrupted', (61, 25),
            xytext=(0.8, 0.9), textcoords='axes fraction',
            arrowprops=dict(facecolor='black', shrink=0.05),
            fontsize=16,
            horizontalalignment='right', verticalalignment='top')

plt.show()
输出

更新于:09-06-2021
665 次浏览

广告