
 数据结构
数据结构 网络
网络 RDBMS
RDBMS 操作系统
操作系统 Java
Java iOS
iOS HTML
HTML CSS
CSS Android
 Python
 C 编程
C 编程 C++
C++ C#
C# MongoDB
 MySQL
MySQL Javascript
 PHP
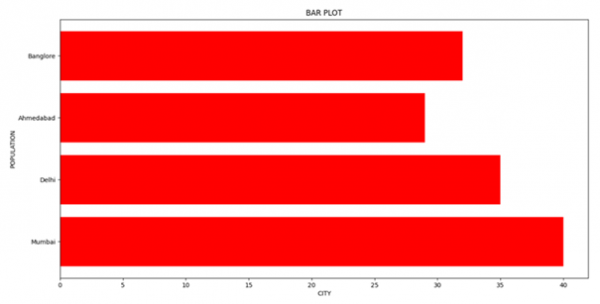
PHP使用 Matplotlib 显示水平条形图
在这个程序中,我们将使用 matplotlib 库绘制条形图。使用 matplotlib 库解决 matplotlib 相关问题的最重要步骤是导入 matplotlib 库。语法是
import matplotlib.pyplot as plt
Pyplot 是一个命令样式函数的集合,使 Matplotlib 像 MATLAB 一样工作。我们将使用函数 barh() 来绘制水平条形图
算法
Step 1: Define a list of values.
Step 2: Use the barh() function in the matplotlib.pyplot library and define different parameters like height width, etc.
Step 3: Label the axes using xlabel() and ylabel().
Step 3: Plot the graph using show().
示例代码
import matplotlib.pyplot as plt

data_x = ['Mumbai', 'Delhi', 'Ahmedabad', 'Banglore']
data_y = [40, 35, 29, 32]

plt.xlabel("CITY")
plt.ylabel("POPULATION")
plt.title("BAR PLOT")
plt.barh(data_x, data_y, color='red')
plt.show()
输出

更新于: 16-3-2021
803 浏览

广告