
 数据结构
数据结构 网络
网络 RDBMS
RDBMS 操作系统
操作系统 Java
Java iOS
iOS HTML
HTML CSS
CSS 安卓
安卓 Python
 C 编程
C 编程 C++
C++ C#
C# MongoDB
 MySQL
MySQL Javascript
 PHP
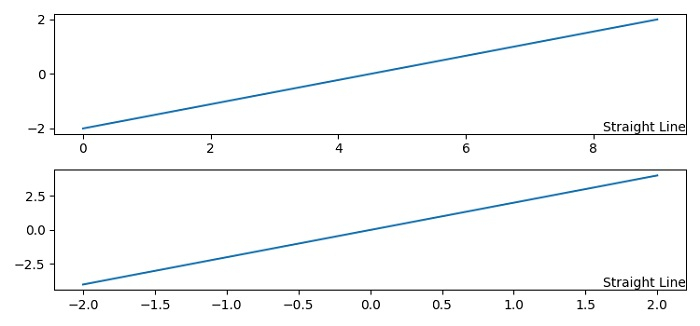
PHP如何在 Python/Matplotlib 中将文字放置在等比例图形的角上?
如要在 matplotlib 中将文本放置在等比例图形的角上,我们可以执行以下步骤 −
设置图形大小并调整子图之间和周围的间距。
使用 subplots() 方法创建图形和一组子图。
使用 numpy 创建 x 数据点。
使用 plot() 方法在 axis ax1 上绘制 x。
使用 plot() 方法在 ax2 上绘制 x 和 2*x。
如要将文本放在图形的角上,针对不同的轴使用 annotate() 方法。
如要显示图表,使用 show() 方法。
示例
from matplotlib import pyplot as plt

plt.rcParams["figure.figsize"] = [7.50, 3.50]
plt.rcParams["figure.autolayout"] = True
fig, axes = plt.subplots(2)
x = np.linspace(-2, 2, 10)
axes[0].plot(x)
axes[1].plot(x, 2*x)
for ax in axes:
   ax.annotate('Straight Line', xy=(1, 0),xycoords='axes fraction', fontsize=10, horizontalalignment='right', verticalalignment='bottom')
plt.show()
输出

更新时间: 2021-06-03
2K+ 次浏览

广告