
 数据结构
数据结构 网络
网络 RDBMS
RDBMS 操作系统
操作系统 Java
Java iOS
iOS HTML
HTML CSS
CSS Android
 Python
 C 编程
C 编程 C++
C++ C#
C# MongoDB
 MySQL
MySQL Javascript
 PHP
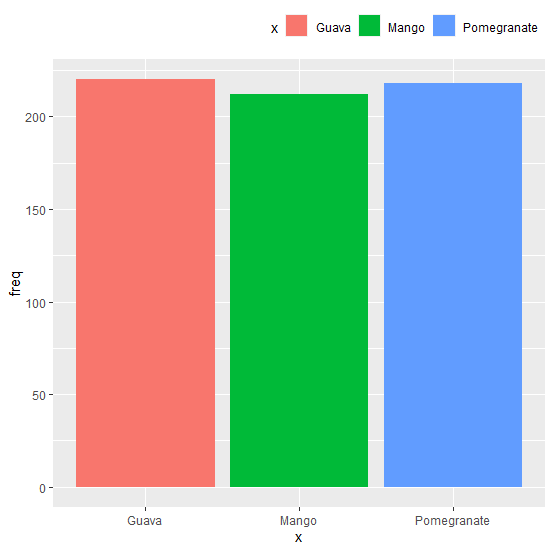
PHP如何在 R 中使用 ggplot2 将图例设置在右上角?
使用 ggplot2 创建的绘图中的默认图例位置为右侧,但我们可以通过使用具有 legend.position 参数和 legend.justification 参数的主题函数来更改位置。要将图例设置在右上角,我们可以使用 legend.position="top" 和 legend.justification="right"。
示例
考虑下面的数据帧
考虑下面的数据帧
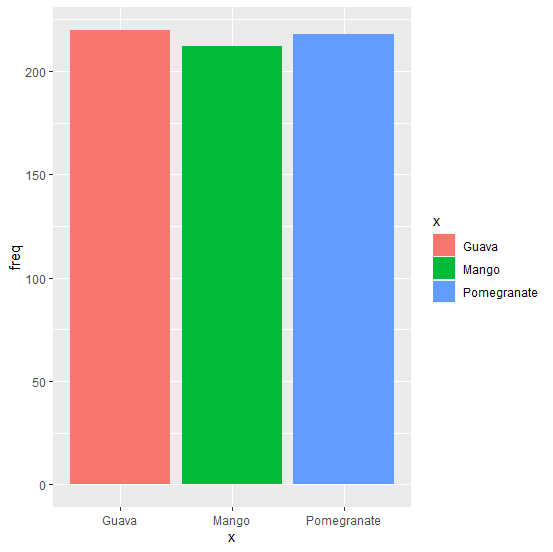
> x<-c("Mango","Guava","Pomegranate")
> freq<-c(212,220,218)
> df<-data.frame(x,freq)
> df
输出
x freq
1 Mango 212
2 Guava 220
3 Pomegranate 218
加载 ggplot2 包并使用图例创建条形图
> library(ggplot2)
> ggplot(df,aes(x,freq,fill=x))+geom_bar(stat="identity")
输出
在图表右上角创建带图例的条形图
示例
> ggplot(df,aes(x,freq,fill=x))+geom_bar(stat="identity")+theme(legend.position="top",legend.justification="right")
输出

更新日期:07-11-2020
3K+ 浏览量

广告