
 数据结构
数据结构 网络
网络 RDBMS
RDBMS 操作系统
操作系统 Java
Java iOS
iOS HTML
HTML CSS
CSS Android
 Python
 C 编程
C 编程 C++
C++ C#
C# MongoDB
 MySQL
MySQL Javascript
 PHP
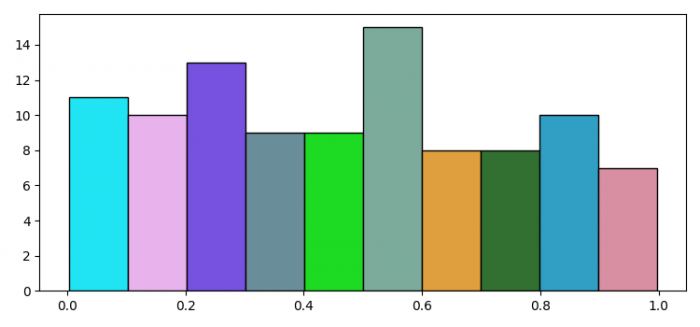
PHP如何在 Python matplotlib 直方图中为不同的条形指定不同的颜色?
如需在 matplotlib 直方图中针对不同的条形指定不同的颜色,可执行以下步骤 −
步骤
设置图像大小并调整子图之间的内边距和子图周围的内边距。
创建图像和一组子图。
用随机数据绘制直方图,且样本数据为 100。
在一定范围内的柱状图集进行迭代,为每条柱状图设置随机的填充颜色。
使用 **show()** 方法显示图片。
实例
import numpy as np
import matplotlib.pyplot as plt
import random
import string

# Set the figure size
plt.rcParams["figure.figsize"] = [7.50, 3.50]
plt.rcParams["figure.autolayout"] = True

# Figure and set of subplots
fig, ax = plt.subplots()

# Random data
data = np.random.rand(100)

# Plot a histogram with random data
N, bins, patches = ax.hist(data, edgecolor='black', linewidth=1)

# Random facecolor for each bar
for i in range(len(N)):
   patches[i].set_facecolor("#" + ''.join(random.choices("ABCDEF" + string.digits, k=6)))

# Display the plot
plt.show()
输出
将产生以下输出 −

更新于: 2022-02-01
5K+ 浏览量

广告