
 数据结构
数据结构 网络
网络 RDBMS
RDBMS 操作系统
操作系统 Java
Java iOS
iOS HTML
HTML CSS
CSS Android
 Python
 C 编程
C 编程 C++
C++ C#
C# MongoDB
 MySQL
MySQL Javascript
 PHP
PHP不在有 DISPLAY 的情况下使用 matplotlib 是否可行?
我们可以在本地机器中保存当前数字并显示它。
步骤
- 设置图片大小并调整 subplot 之间以及周围的填充。
- 使用 numpy 创建 x 数据点。
- 使用 plot() 方法绘制 x 和 y 数据点。
- 使用 savefig() 方法保存图形。
示例
import numpy as np
import matplotlib.pyplot as plt
plt.rcParams["figure.figsize"] = [7.50, 3.50]
plt.rcParams["figure.autolayout"] = True
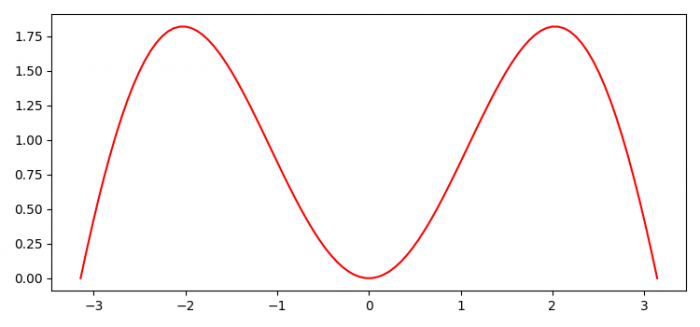
x = np.linspace(-np.pi, np.pi, 100)
plt.plot(x, np.sin(x) * x, c='red')
plt.savefig("myimage.png")输出
当执行代码时,它会将以下图像作为“myimage.png”保存在项目目录中。

更新于:2021 年 6 月 5 日
669 次浏览

广告