
 数据结构
数据结构 网络
网络 关系数据库管理系统 (RDBMS)
 操作系统
操作系统 Java
Java iOS
iOS HTML
HTML CSS
CSS Android
 Python
 C 编程
C 编程 C++
C++ C#
C# MongoDB
 MySQL
MySQL Javascript
 PHP
PHP在 Matplotlib 子图中行和列标题
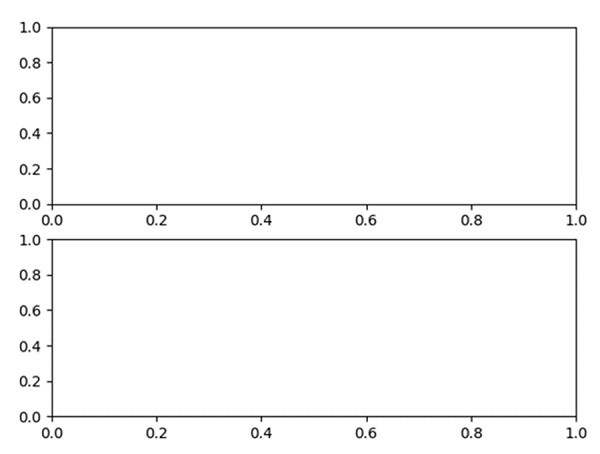
使用子图方法,我们可以配置行数和列数。nrows*nclos 将创建绘制图表的位置数。
步骤
行数 = 2,列数 = 1,因此总位置数为:2*1 = 2。
向当前图形中添加子图,nrow = 2,列 = 1,索引 = 1。
向当前图形中添加子图,nrow = 2,列 = 1,索引 = 2。
使用 plt.show(),我们可以显示图形。
示例
from matplotlib import pyplot as plt

row_count = 2
col_count = 1
index1 = 1

# no. of subplots are: row*col, index is the position of figure.

plt.subplot(row_count, col_count, index1)

index2 = 2
plt.subplot(row_count, col_count, index2)

plt.show()
输出

更新日期:2021-03-16
436 次浏览

广告