
 数据结构
数据结构 网络
网络 RDBMS
RDBMS 操作系统
操作系统 Java
Java iOS
iOS HTML
HTML CSS
CSS Android
 Python
 C 编程
C 编程 C++
C++ C#
C# MongoDB
 MySQL
MySQL Javascript
 PHP
PHPPython 绘图中的上标
要在 Python 中放置某个上标,我们可以采取以下步骤 -
使用 numpy,为 a 和 f 创建点。
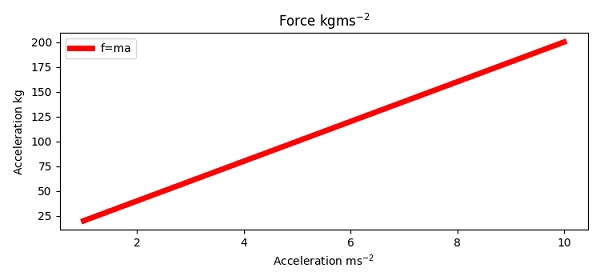
使用 plot() 方法,用标签 f=ma 绘制 f = ma 曲线。
使用上标为该绘图添加标题,即 kgms-2。
使用上标为该绘图添加 xlabel,即 ms-2。
使用上标为该绘图添加 ylabel,即 kg。
要放置图例,请使用 legend() 方法。
要显示图形,请使用 show() 方法。
范例
import numpy as np
from matplotlib import pyplot as plt
plt.rcParams["figure.figsize"] = [7.50, 3.50]
plt.rcParams["figure.autolayout"] = True
a = np.linspace(1, 10, 100)
m = 20
f = m*a
plt.plot(a, f, c="red", lw=5, label="f=ma")
plt.title("Force $\mathregular{kgms^{-2}}$")
plt.xlabel("Acceleration $\mathregular{ms^{-2}}$")
plt.ylabel("Acceleration $\mathregular{kg}$")
plt.legend()
plt.show()
输出

更新于:2021 年 4 月 10 日
10000+ 次浏览

广告