使用 Python Matplotlib 绘制基本甘特图
项目管理可能是一项复杂的工作,需要仔细计划、组织和跟踪任务以及时间表。甘特图长期以来一直是项目管理中的一个主要工具,它以可视化的方式展示了项目计划、任务时长和依赖关系。这些图表使项目经理和团队能够有效地计划、监控和沟通项目进度。
在本文中,我们将开始使用强大的 Python 库 Matplotlib 创建基本的甘特图。通过利用 Matplotlib 的绘图功能,我们将创建动态且信息丰富的甘特图,从而增强和扩展可视化和决策能力。
使用 Python Matplotlib 绘制基本甘特图
甘特图是项目经理的重要工具,使他们能够概述项目计划并跟踪任务随时间的执行情况。Python 凭借其丰富的库生态系统,为创建甘特图提供了灵活的解决方案。Matplotlib 是 Python 中最流行的数据可视化库之一,它为生成可自定义的甘特图提供了强大的平台。使用 Matplotlib,您可以轻松地绘制任务、设置持续时间并以清晰准确的方式可视化项目时间线。无论是个人项目、团队协作还是专业项目管理,掌握使用 Python Matplotlib 创建基本甘特图是一项重要的技能。
方法 1:Python – 使用 Python Matplotlib 的水平条形图绘制基本甘特图
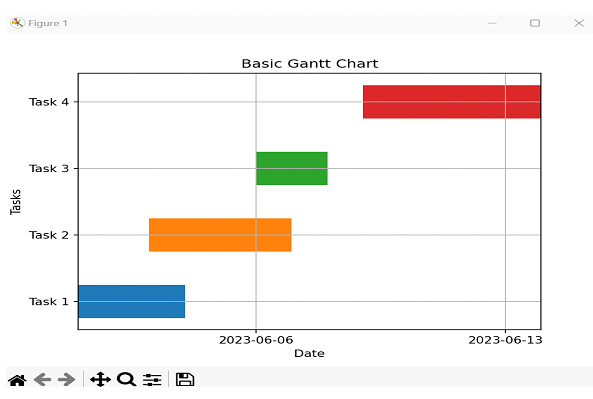
在这种方法中,我们将使用 Matplotlib 的水平条形图来创建甘特图。我们将把每个任务绘制成一个水平条,并显示其开始和结束日期。
算法
步骤 1 − 导入必要的库:Matplotlib 和 NumPy。
步骤 2 − 创建甘特图的数据,包括任务名称、开始日期和持续时间。
步骤 3 − 初始化图表和坐标轴。
步骤 4 − 将 y 轴刻度标签设置为任务名称。
步骤 5 − 遍历任务并将其绘制为水平条。
步骤 6 − 根据任务的开始和结束日期设置 x 轴限制。
步骤 7 − 使用适当的标签、标题和网格线自定义图表。
步骤 8 − 使用 'plt.show()' 显示甘特图。
示例
import matplotlib.pyplot as plt
import numpy as np
import pandas as pd
import matplotlib.dates as mdates

# Step 2: Create the data for the Gantt chart
tasks = ['Task 1', 'Task 2', 'Task 3', 'Task 4']
start_dates = ['2023-06-01', '2023-06-03', '2023-06-06', '2023-06-09']
durations = [3, 4, 2, 5]

# Step 3: Initialize the figure and axis
fig, ax = plt.subplots()

# Step 4: Set y-axis tick labels
ax.set_yticks(np.arange(len(tasks)))
ax.set_yticklabels(tasks)

# Step 5: Plot each task as a horizontal bar
for i in range(len(tasks)):
    start_date = pd.to_datetime(start_dates[i])
    end_date = start_date + pd.DateOffset(days=durations[i])
    ax.barh(i, end_date - start_date, left=start_date, height=0.5, align='center')

# Step 6: Set x-axis limits
min_date = pd.to_datetime(min(start_dates))
max_date = pd.to_datetime(max(start_dates)) + pd.DateOffset(days=max(durations))
ax.set_xlim(min_date, max_date)

# Step 7: Customize the chart
ax.xaxis_date()
ax.xaxis.set_major_locator(mdates.WeekdayLocator())
ax.xaxis.set_major_formatter(mdates.DateFormatter('%Y-%m-%d'))
ax.set_xlabel('Date')
ax.set_ylabel('Tasks')
ax.set_title('Basic Gantt Chart')

# Step 8: Display the chart
plt.grid(True)
plt.show()
输出

方法 2:Python – 使用 Python Matplotlib 和 Seaborn 的条形图绘制基本甘特图
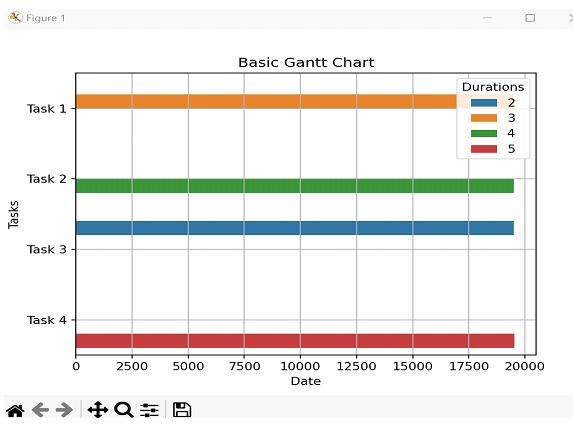
在这种方法中,我们将使用 Seaborn 库(它构建在 Matplotlib 之上)来创建甘特图。我们将使用 Seaborn 的 barplot() 函数,它提供了一个高级接口来创建条形图。
算法
步骤 1 − 导入必要的库:Seaborn 和 Pandas。
步骤 2 − 创建一个 Pandas 数据帧来保存任务数据,包括任务名称、开始日期和持续时间
步骤 3 − 初始化图表和坐标轴。
步骤 4 − 使用 Seaborn 的 barplot() 函数创建甘特图。
步骤 5 − 使用适当的标签、标题和网格线自定义图表。
步骤 6 − 使用 plt.show() 显示甘特图。
示例
import seaborn as sns
import pandas as pd
import matplotlib.pyplot as plt
import matplotlib.dates as mdates

# Step 2: Create the data for the Gantt chart
data = {
    'Tasks': ['Task 1', 'Task 2', 'Task 3', 'Task 4'],
    'Start Dates': ['2023-06-01', '2023-06-03', '2023-06-06', '2023-06-09'],
    'Durations': [3, 4, 2, 5]
}
df = pd.DataFrame(data)

# Convert 'Start Dates' to numeric duration values
df['Start Dates'] = mdates.datestr2num(df['Start Dates'])

# Step 3: Initialize the figure and axis
fig, ax = plt.subplots()

# Step 4: Create the Gantt chart
sns.barplot(data=df, x='Start Dates', y='Tasks', hue='Durations', ax=ax)

# Step 5: Customize the chart
ax.set_xlabel('Date')
ax.set_ylabel('Tasks')
ax.set_title('Basic Gantt Chart')
ax.grid(True)

# Step 6: Display the chart
plt.show()
输出

结论
在本文中,我们探讨了三种使用 Python 的 Matplotlib 库创建简单甘特图的不同方法。第一种方法使用了水平条形图,第二种方法使用了 Seaborn 的 Barplot 功能,第三种方法使用了 Plotly Express 创建交互式图表。


 数据结构
数据结构 网络
网络 关系型数据库管理系统
 操作系统
操作系统 Java
Java iOS
iOS HTML
HTML CSS
CSS Android
 Python
 C 编程
C 编程 C++
C++ C#
C# MongoDB
 MySQL
MySQL Javascript
 PHP
PHP