
 数据结构
数据结构 网络
网络 关系数据库管理系统(RDBMS)
 操作系统
操作系统 Java
Java iOS
iOS HTML
HTML CSS
CSS Android
 Python
 C语言编程
C语言编程 C++
C++ C#
C# MongoDB
 MySQL
MySQL Javascript
 PHP
PHP使用Tkinter根据长度创建彩色线条
数据可视化是理解和解释复杂信息的必不可少工具。在处理图形表示时,通常需要根据对象的特性为其分配颜色。本文将探讨如何在Python的标准GUI工具包Tkinter中根据线条长度创建彩色线条。通过为不同长度的线条分配不同的颜色,我们可以增强数据的视觉表示,并方便数据解读。
理解概念
在深入实现之前,让我们了解一下根据线条长度创建彩色线条的概念。基本思想是将特定颜色与每条线相关联,其中颜色由线的长度决定。此技术在处理与线长度相关的数值维度的数据时特别有用。例如,您可能拥有一个数据集,其中每个数据点表示线段,而关联值表示其长度。通过将不同的颜色映射到不同的长度范围,您可以创建强调线长度变化的视觉表示。
步骤 1:设置Tkinter环境
首先,确保您已安装Tkinter,因为它包含在大多数Python发行版中。安装完成后,导入必要的模块并创建将在其中显示可视化的主Tkinter窗口。
import tkinter as tk

# Create the main window
window = tk.Tk()
window.geometry("720x250")
window.title("Colored Lines based on Length")

# Set the dimensions of the canvas
canvas_width = 800
canvas_height = 400

# Create the canvas
canvas = tk.Canvas(window, width=canvas_width, height=canvas_height)
canvas.pack()
步骤 2:准备数据
接下来,我们需要准备包含线段及其相关长度的数据。为了演示目的,让我们假设我们有一个元组列表,其中每个元组包含线段的起点和终点以及其长度。
# Sample data (x1, y1, x2, y2, length)
data = [
   (100, 100, 300, 100, 200),
   (100, 200, 400, 200, 300),
   (100, 300, 600, 300, 500),
   (100, 400, 800, 400, 700),
   # Add more data points as needed
]
在此示例中,我们有四个线段,每个线段由其起点和终点的坐标以及相应的长度定义。
步骤 3:定义颜色映射
要根据每个线段的长度分配颜色,我们需要定义颜色映射方案。这可以使用多种技术来完成,例如线性映射、颜色插值或离散颜色类别。为简单起见,让我们定义一个线性颜色映射方案,其中较短的线条分配较浅的颜色,较长的线条分配较深的颜色。
# Define color mapping
color_min = "#FFCCCC"  # Light color for minimum length
color_max = "#FF0000"  # Dark color for maximum length

def map_color(length):
   """
   Map line length to a color within the defined range
   """
   normalized_length = (length - min_length) / (max_length - min_length)
   red = int((1 - normalized_length) * int(color_min[1:3], 16) + normalized_length * int(color_max[1:3], 16))
   green = int((1 - normalized_length) * int(color_min[3:5], 16) + normalized_length * int(color_max[3:5], 16))
   blue = int((1 - normalized_length) * int(color_min[5:7], 16) + normalized_length * int(color_max[5:7], 16))
   color = f"#{red:02x}{green:02x}{blue:02x}"
   return color

# Find the minimum and maximum length in the data
min_length = min(data, key=lambda x: x[4])[4]
max_length = max(data, key=lambda x: x[4])[4]
步骤 4:绘制彩色线条
现在我们已经定义了画布、数据和颜色映射,我们可以根据线条长度绘制彩色线条。
for line in data:
   x1, y1, x2, y2, length = line
   color = map_color(length)
   canvas.create_line(x1, y1, x2, y2, fill=color)
步骤 5:显示可视化结果
要显示可视化结果,我们需要启动Tkinter事件循环。
window.mainloop()
示例
import tkinter as tk

window = tk.Tk()
window.geometry("720x250")
window.title("Colored Lines based on Length")

canvas_width = 800
canvas_height = 400

canvas = tk.Canvas(window, width=canvas_width, height=canvas_height)
canvas.pack()

data = [
   (100, 100, 300, 100, 200),
   (100, 200, 400, 200, 300),
   (100, 300, 600, 300, 500),
   (100, 400, 800, 400, 700),
]

color_min = "#FFCCCC"
color_max = "#FF0000"

def map_color(length):
   normalized_length = (length - min_length) / (max_length - min_length)
   red = int((1 - normalized_length) * int(color_min[1:3], 16) + normalized_length * int(color_max[1:3], 16))
   green = int((1 - normalized_length) * int(color_min[3:5], 16) + normalized_length * int(color_max[3:5], 16))
   blue = int((1 - normalized_length) * int(color_min[5:7], 16) + normalized_length * int(color_max[5:7], 16))
   color = f"#{red:02x}{green:02x}{blue:02x}"
   return color

min_length = min(data, key=lambda x: x[4])[4]
max_length = max(data, key=lambda x: x[4])[4]

for line in data:
   x1, y1, x2, y2, length = line
   color = map_color(length)
   canvas.create_line(x1, y1, x2, y2, fill=color)

window.mainloop()
此完整的实现示例包含文章中概述的所有步骤。它创建一个Tkinter窗口,定义画布尺寸,准备数据,根据线条长度映射颜色,并在画布上绘制彩色线条。
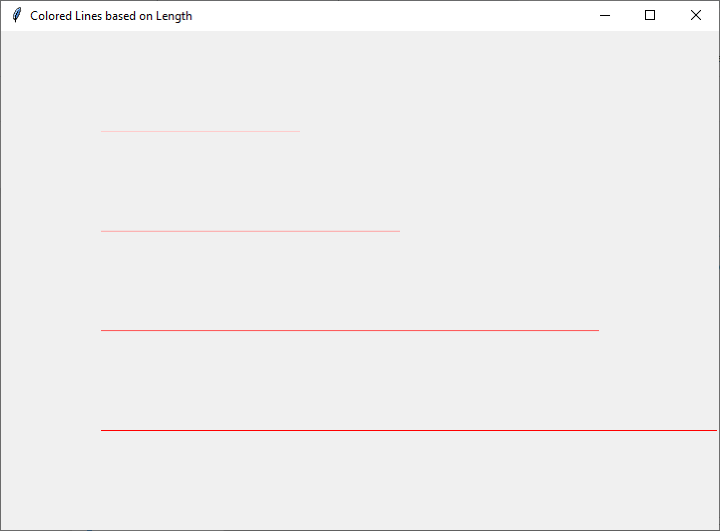
输出
通过运行此示例,您将能够可视化彩色线条,其中颜色表示每个线段的长度。您可以自定义颜色、数据和画布尺寸以满足您的特定需求,并进一步增强可视化效果。
结论
总之,根据长度创建彩色线条可以显著增强数据的视觉表示。Tkinter提供了一个灵活且强大的框架,用于在Python中实现此类可视化。通过遵循分步指南并使用提供的实现示例,您可以轻松地使用Tkinter创建动态且信息丰富的数据可视化。

浏览量:143
