
 数据结构
数据结构 网络
网络 关系型数据库管理系统
 操作系统
操作系统 Java
Java iOS
iOS HTML
HTML CSS
CSS Android
 Python
 C 语言编程
 C++
C++ C#
C# MongoDB
 MySQL
MySQL Javascript
 PHP
PHP如何使用 TensorFlow 在 Auto MPG 数据集上预测 MPG 值的 DNN(深度神经网络)模型?
Tensorflow 是 Google 提供的一个机器学习框架。它是一个开源框架,与 Python 结合使用以实现算法、深度学习应用程序等等。它用于研究和生产目的。张量是 TensorFlow 中使用的数据结构。它有助于连接流图中的边。此流图称为“数据流图”。张量只不过是多维数组或列表。
可以使用以下代码行在 Windows 上安装“tensorflow”包:
pip install tensorflow
回归问题的目标是预测连续或离散变量的输出,例如价格、概率、是否会下雨等等。
我们使用的数据集称为“Auto MPG”数据集。它包含 1970 年代和 1980 年代汽车的燃油效率。它包括重量、马力、排量等属性。通过此,我们需要预测特定车辆的燃油效率。
我们使用 Google Colaboratory 来运行以下代码。Google Colab 或 Colaboratory 帮助通过浏览器运行 Python 代码,并且无需任何配置即可免费访问 GPU(图形处理单元)。Colaboratory 建立在 Jupyter Notebook 之上。以下是代码片段:
。
示例
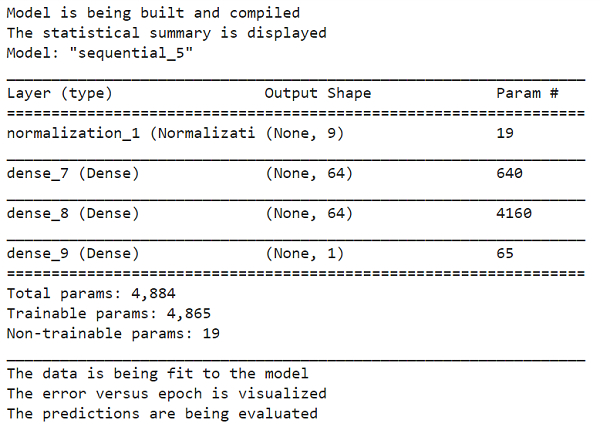
print("Model is being built and compiled")
dnn_model = build_compile_model(normalizer)
print("The statistical summary is displayed ")
dnn_model.summary()
print("The data is being fit to the model")
history = dnn_model.fit(
train_features, train_labels,
validation_split=0.2,
verbose=0, epochs=100)
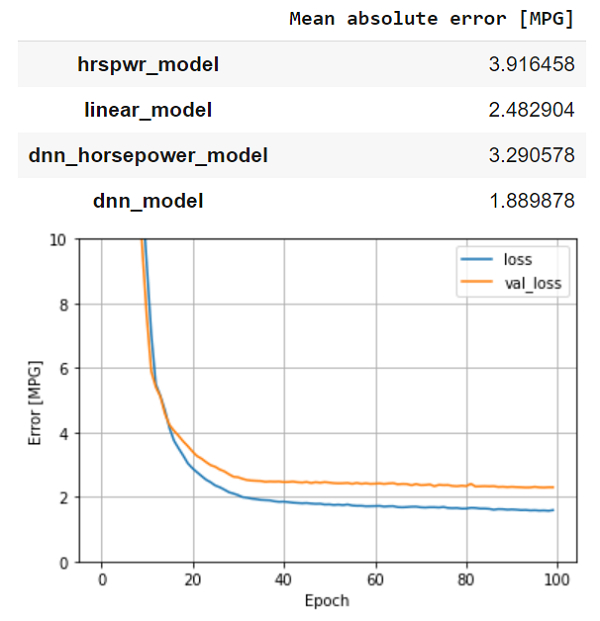
print("The error versus epoch is visualized")
plot_loss(history)
print("The predictions are being evaluated")
test_results['dnn_model'] = dnn_model.evaluate(test_features, test_labels, verbose=0)
pd.DataFrame(test_results, index=['Mean absolute error [MPG]']).T代码来源 - https://tensorflowcn.cn/tutorials/keras/regression
输出
解释
模型已构建并编译。
使用“summary”函数显示计数、均值、中位数等统计值。
此编译后的模型适合数据。
在控制台上绘制了步数与预测误差的关系可视化图。
与线性回归相比,使用 DNN 更好。

更新于: 2021年1月20日
205 次查看

广告