
 数据结构
数据结构 网络
网络 关系数据库管理系统 (RDBMS)
 操作系统
操作系统 Java
Java iOS
iOS HTML
HTML CSS
CSS Android
 Python
 C 语言编程
 C++
C++ C#
C# MongoDB
 MySQL
MySQL Javascript
 PHP
PHP如何在 OpenCV 中使用 Python 在图像上绘制多边形?
要在图像上绘制多边形,我们使用 `cv2.polylines()` 方法。我们可以在图像上绘制开放或封闭的多边形。绘制开放多边形时,首尾两点不会连接。
语法
`cv2.polylines()` 的语法如下:
cv2.polylines(src, [pts], isClosed, color, thickness)
参数
**src** - 要绘制多边形的输入图像。
**pts** - 点的数组列表。
**isClosed** - 设置为 `isClosed=True` 绘制封闭多边形,对于开放多边形,设置为 `isClosed=False`。
**color** - 线条的颜色。
**thickness** - 线条的粗细。默认粗细设置为 `thickness=1`。
步骤
您可以按照以下步骤在图像上绘制多边形:
导入所需的库。在以下所有 Python 示例中,所需的 Python 库是 **OpenCV** 和 **NumPy**。确保您已经安装了它们。
import cv2
import numpy as np
使用 `cv2.imread()` 方法读取输入图像。
img = cv2.imread('nature_waterfall.jpg')
定义点的二维数组并将其重新整形。
points = np.array([[155,320],[250,420],[345,50]])
pts = points.reshape(-1,1,2) # now shape [3,1,2]
在图像上绘制多边形,传递参数的所需值:`isClosed`、`color`、`thickness`。要绘制封闭多边形,请传递 `isClosed=True`;要绘制开放多边形,请设置 `isClosed=False`。
cv2.polylines(img, [pts1], isClosed=True, color=(255,0,0), thickness = 2)
显示绘制了多边形的图像。
cv2.imshow("Polylines", img_poly)
cv2.waitKey(0)
cv2.destroyAllWindows()
在以下示例中,我们将使用此图像作为 **输入文件**。

示例 1
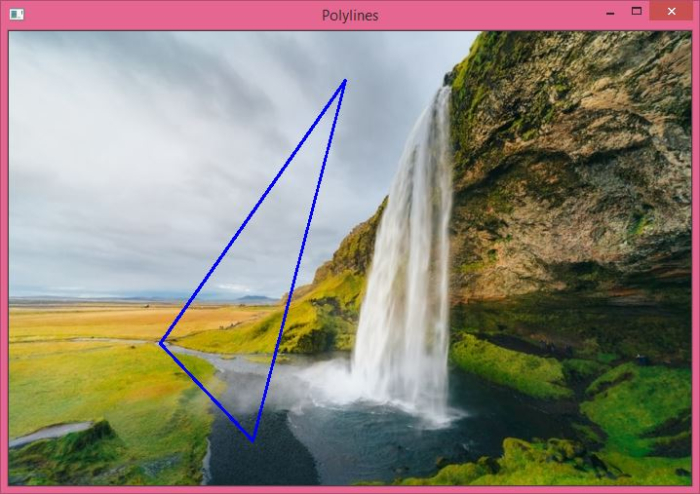
在下面的 Python 程序中,我们在输入图像上绘制了一条蓝色封闭多边形。
# import required libraries
import cv2
import numpy as np

# load the input image
img = cv2.imread('nature_waterfall.jpg')

# define an array of three points on image to draw the polylines
# shape of point array [3,2]
points = np.array([[155,320],[250,420],[345,50]])

# reshape the point array to make it 3D
pts = points.reshape(-1,1,2) # now shape [3,1,2]

# draw polylines on the image, passing desired values of the arguments
img_poly = cv2.polylines(img, [pts], isClosed=True, color=(255,0,0), thickness = 2)

# display the image with drawn polylines
cv2.imshow("Polylines", img_poly)
cv2.waitKey(0)
cv2.destroyAllWindows()
输出
执行上述程序后,将生成以下 **输出** 窗口。
请注意,图像上绘制的多边形是封闭的。我们可以绘制一个未封闭的多边形。在这种情况下,首尾两点不会连接。请查看第二个示例,了解图像上绘制的两种类型的线条。
示例 2
在下面的 Python 程序中,我们在输入图像上绘制了三条多边形。第一条和第三条多边形是封闭的,而第二条多边形是开放的。
import cv2
import numpy as np
# read the input image
img = cv2.imread('nature_waterfall.jpg')

# define the array of points
points1 = np.array([[455,200],[155,420],[145,350]])
points2 = np.array([[200,120],[200,320],[405,350], [600,30]])
points3 = np.array([[100,20],[320,20],[45,350], [100,150]])

# reshape the points
pts1 = points1.reshape(-1,1,2)
pts2 = points2.reshape(-1,1,2)
pts3 = points3.reshape(-1,1,2)

# draw the polylines
cv2.polylines(img, [pts1], isClosed=True, color=(255,0,0), thickness = 2)
cv2.polylines(img, [pts2], isClosed=False, color=(0,255,0), thickness = 2)
cv2.polylines(img, [pts3], isClosed=True, color=(0,0,255), thickness = 2)

# display the image with drawn polylines
cv2.imshow("Polylines", img)
cv2.waitKey(0)
cv2.destroyAllWindows()
输出
执行上述程序后,将生成以下 **输出** 窗口。
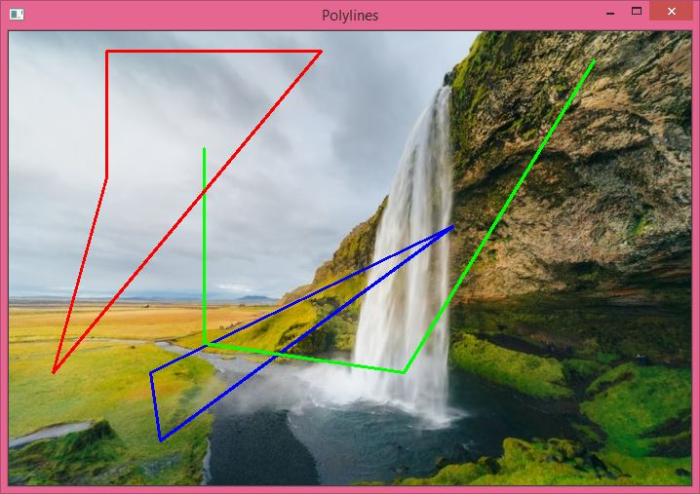
请注意,绿色多边形是开放的,而红色和蓝色多边形是封闭的。

5K+ 次浏览
