
 数据结构
数据结构 网络
网络 RDBMS
RDBMS 操作系统
操作系统 Java
Java iOS
iOS HTML
HTML CSS
CSS Android
 Python
 C 编程
C 编程 C++
C++ C#
C# MongoDB
 MySQL
MySQL Javascript
 PHP
PHP如何获取 Matplotlib生成的散点图的像素坐标?
如需获取 matplotlib 生成的散点图的像素坐标,我们可以采取以下步骤 -
- 设置图形大小并调整子图之间和周围的边距。
- 初始化一个变量 “n” 来保存样本数据数。
- 创建一个图形和一组子图。
- 绘制散点图。
- 使用 get_data() 方法获取 x 和 y 数据点。
- 获取绘图的像素值。
- 获取像素转换数据。
- 以点或像素获取图形宽度和高度
- 打印 x 和 y 像素值。
- 使用 show() 方法显示图形。
示例
import numpy as np
import matplotlib.pyplot as plt

plt.rcParams["figure.figsize"] = [7.00, 3.50]
plt.rcParams["figure.autolayout"] = True

n = 10
fig, ax = plt.subplots()

points, = ax.plot(np.random.random(n), np.random.random(n), 'r*')
x, y = points.get_data()

pixels = ax.transData.transform(np.vstack([x, y]).T)
x, y = pixels.T

width, height = fig.canvas.get_width_height()
y = height - y

print("The pixel coordinates are: ")
for xp, yp in zip(x, y):
   print('{x:0.2f}\t{y:0.2f}'.format(x=xp, y=yp))

plt.show()
输出
将生成以下输出
![]()
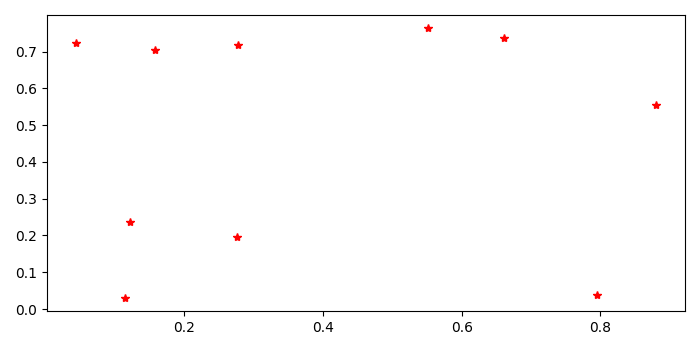
还将在控制台中打印 matplotlib 生成的散点图的像素坐标
The pixel coordinates are:
564.93   161.83
446.27   112.60
153.39   247.65
236.90   258.34
519.10   301.04
237.66   118.16
149.71   303.29
386.74   105.81
172.93   121.81
110.94   116.20

更新于: 22-9 月-2021
2K+ 查看数

广告