
 数据结构
数据结构 网络
网络 关系数据库管理系统(RDBMS)
 操作系统
操作系统 Java
Java iOS
iOS HTML
HTML CSS
CSS Android
 Python
 C语言编程
C语言编程 C++
C++ C#
C# MongoDB
 MySQL
MySQL Javascript
 PHP
PHP如何在MATLAB中绘制二元函数?
MATLAB 提供各种内置函数,借助不同类型的绘图(如网格图、曲面图、散点图等)来绘制二元函数。在本教程中,我将解释在 MATLAB 中绘制二元函数的过程。
在MATLAB中绘制二元函数
下面解释了在 MATLAB 中绘制二元函数的分步过程。
步骤 (1) - 定义 x 和 y 点的范围。
步骤 (2) - 创建 x 和 y 点的网格。为此,请在 MATLAB 中使用“meshgrid”函数。
语法
[X, Y] = meshgrid(x, y);
步骤 (3) - 定义需要绘制的二元函数。
步骤 (4) - 创建函数的绘图。
因此,在 MATLAB 中绘制二元函数是一个简单的四步过程。
让我们借助 MATLAB 示例来了解上述算法。
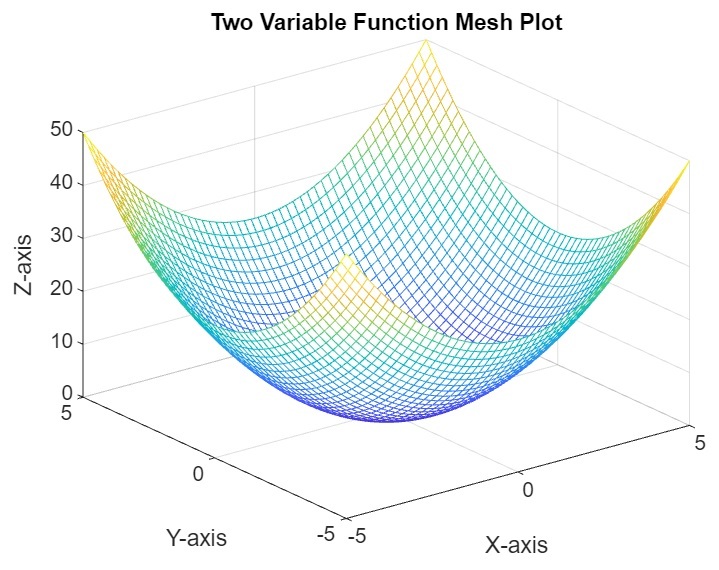
使用网格图绘制二元函数
在 MATLAB 中,我们有一个名为“mesh”的函数,用于绘制函数的三维曲面图。我们可以用它来绘制二元函数。
示例
以下示例演示了如何使用“mesh”函数绘制二元函数。
% MATLAB code to plot function of two-variable using mesh surface plot
% Define the range of x and y points
x = linspace(-5, 5, 50);
y = linspace(-5, 5, 50);

% Create a grid of x and y points
[X, Y] = meshgrid(x, y);

% Define a function of two variables
Z = X.^2 + Y.^2;

% Plot the function using the mesh surface plot
mesh(X, Y, Z);
title('Two Variable Function Mesh Plot');
xlabel('X-axis');
ylabel('Y-axis');
zlabel('Z-axis');
输出
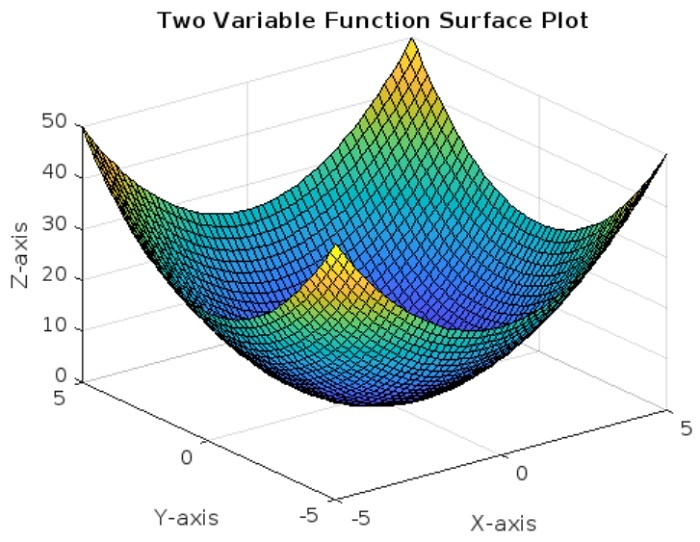
使用曲面图绘制二元函数
在 MATLAB 中,我们还可以使用曲面图绘制二元函数。为此,MATLAB 库中有一个名为“surf”的内置函数,它可以为定义的函数绘制三维曲面图。
示例
让我们来看一个示例,了解如何在 MATLAB 中使用“surf”函数绘制二元函数。
% MATLAB code to plot a function of two-variable using surface plot
% Define the range of x and y points
x = linspace(-5, 5, 50);
y = linspace(-5, 5, 50);

% Create a grid of x and y points
[X, Y] = meshgrid(x, y);

% Define a function of two variables
Z = X.^2 + Y.^2;

% Plot the function using the 3D surface plot
surf(X, Y, Z);
title('Two Variable Function Surface Plot');
xlabel('X-axis');
ylabel('Y-axis');
zlabel('Z-axis');
输出
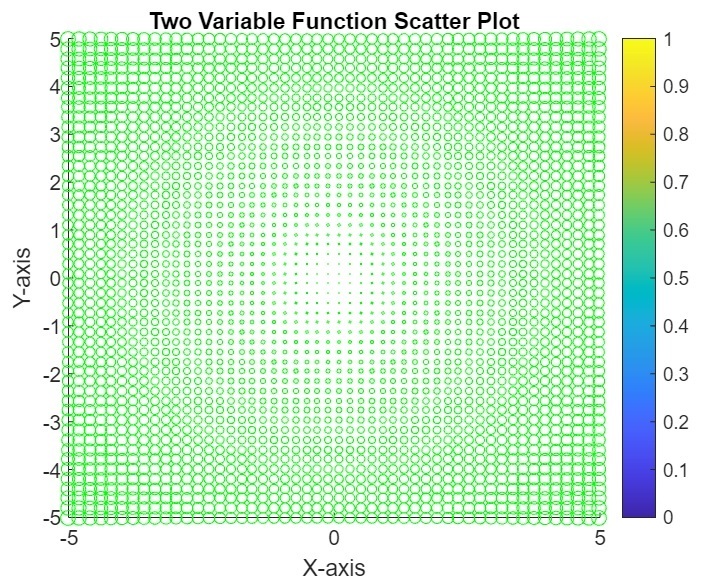
使用散点图绘制二元函数
我们还可以使用散点图绘制二元函数。为此,MATLAB 中有一个名为“scatter”的内置函数。
示例
这是一个演示如何使用散点图绘制二元函数的示例。
% MATLAB code to plot a function of two-variable using scatter plot
% Define the range of x and y points
x = linspace(-5, 5, 50);
y = linspace(-5, 5, 50);

% Create a grid of x and y points
[X, Y] = meshgrid(x, y);

% Define a function of two variables
Z = X.^2 + Y.^2;

% Plot the function using the scatter plot
scatter(X(:), Y(:), Z(:), 'green');
title('Two Variable Function Scatter Plot');
xlabel('X-axis');
ylabel('Y-axis');
colorbar;	% Z values
输出
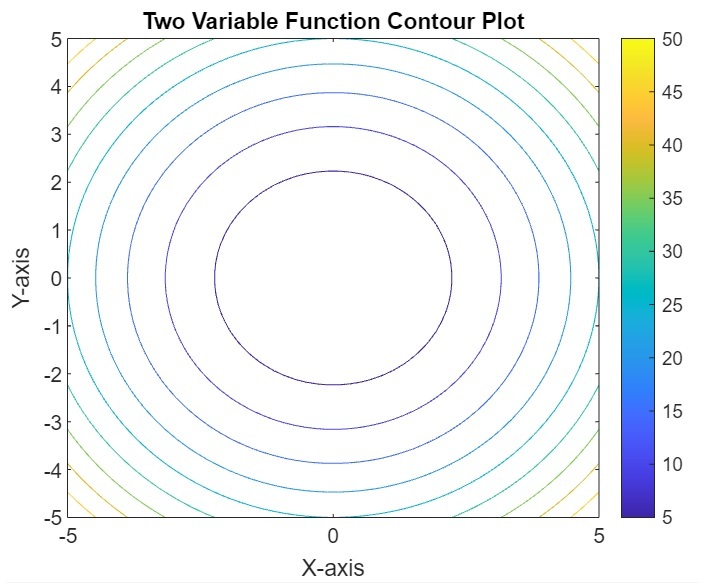
使用等高线图绘制二元函数
在 MATLAB 中,我们可以使用等高线图绘制二元函数。为此,我们在 MATLAB 中使用“contour”函数。
示例
以下示例显示了使用等高线图绘制二元函数的 MATLAB 代码实现。
% MATLAB code to plot a function of two-variable using contour plot
% Define the range of x and y points
x = linspace(-5, 5, 50);
y = linspace(-5, 5, 50);

% Create a grid of x and y points
[X, Y] = meshgrid(x, y);

% Define a function of two variables
Z = X.^2 + Y.^2;

% Plot the function using the contour plot
contour(X, Y, Z);
title('Two Variable Function Contour Plot');
xlabel('X-axis');
ylabel('Y-axis');
colorbar;	% Z values
输出
结论
在 MATLAB 中,我们可以使用不同类型的绘图来绘制二元函数。在本教程中,我解释了在 MATLAB 中绘制二元函数的分步过程和示例。您也可以尝试使用不同的函数编写所有这些代码。

更新于:2023年10月6日
531 次浏览

广告