
 数据结构
数据结构 网络
网络 RDBMS
RDBMS 操作系统
操作系统 Java
Java iOS
iOS HTML
HTML CSS
CSS 安卓
安卓 Python
 C 编程
C 编程 C++
C++ C#
C# MongoDB
 MySQL
MySQL JavaScript
 PHP
PHP如何在 Python Matplotlib 中绘制多变量函数?
要在 Python 中绘制多变量函数,我们可以执行以下步骤 -
步骤
设置图片大小并调整子图之间的填充间距。
使用 numpy 创建随机的x、y和z数据点。
创建图片和一组子图。
使用x、y和z数据点创建散点图。
为 ScalarMappable 实例创建一个颜色条,s。
要显示图片,请使用show()方法。
示例
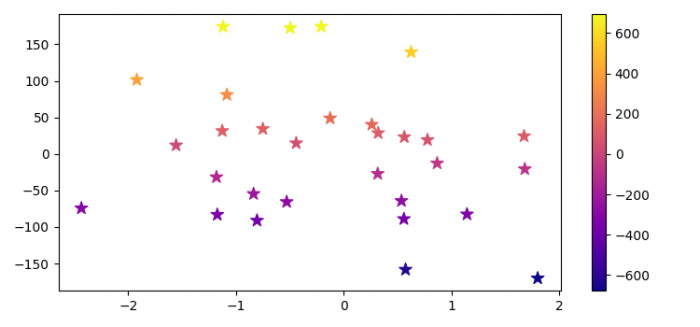
import numpy as np
import matplotlib.pyplot as plt

plt.rcParams["figure.figsize"] = [7.50, 3.50]
plt.rcParams["figure.autolayout"] = True

def func(x, y):
   return 3 * x + 4 * y - 2 + np.random.randn(30)

x, y = np.random.randn(2, 30)
y *= 100
z = func(x, y)

fig, ax = plt.subplots()

s = ax.scatter(x, y, c=z, s=100, marker='*', cmap='plasma')

fig.colorbar(s)

plt.show()
输出
它将生成以下输出 -

更新于: 2022-02-01
6K+ 查看次数

广告