
 数据结构
数据结构 网络
网络 关系型数据库管理系统
 操作系统
操作系统 Java
Java iOS
iOS HTML
HTML CSS
CSS Android
 Python
 C 语言
C 语言 C++
C++ C#
C# MongoDB
 MySQL
MySQL javascript
 PHP
PHP如何在 Matplotlib 绘制循环中为标记和线条设置相同颜色?
要为 matplotlib 中的标记和线设置相同颜色,我们可以采取以下步骤:
使用 numpy 初始化m、n和x数据点。
使用figure()方法创建新图形或激活现有图形。
使用clf()方法清除图形。
使用subplot()方法向当前图形添加子图。
从可迭代标记类型中获取标记。
遍历 1 到 n 的范围。
在循环中使用带有相同标记和颜色的plot()方法绘制线条和标记。
使用show()方法显示图形。
示例
import numpy as np
import itertools
from matplotlib import pyplot as plt
plt.rcParams["figure.figsize"] = [7.00, 3.50]
plt.rcParams["figure.autolayout"] = True
m = 5
n = 5
x = np.zeros(shape=(m, n))
plt.figure()
plt.clf()
plt.subplot(111)
marker = itertools.cycle(('o', 'v', '^', '<', '>', 's', '8', 'p'))
for i in range(1, n):
x = np.dot(i, [1, 1.1, 1.2, 1.3])
y = x ** 2
plt.plot(x, y, linestyle='', markeredgecolor='none', marker=next(marker), alpha=1)
plt.plot(x, y, linestyle='-')
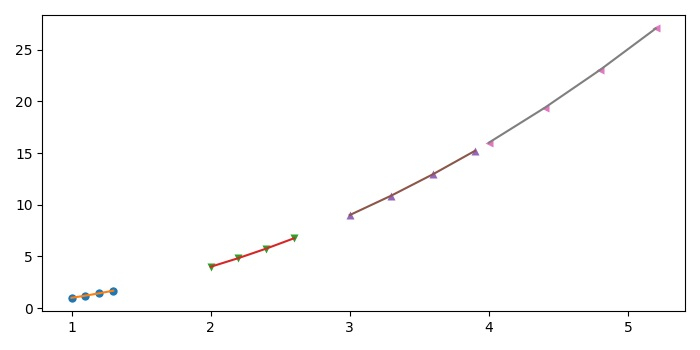
plt.show()输出

更新于:2021-05-15
1K+ 浏览量

广告