
 数据结构
数据结构 网络
网络 关系数据库管理系统
 操作系统
操作系统 Java
Java iOS
iOS HTML
HTML CSS
CSS Android
 Python
 C 编程
C 编程 C++
C++ C#
C# MongoDB
 MySQL
MySQL JavaScript
 PHP
PHP在 Matplotlib 中创建两张子图后如何共享它们的 x 轴?
首先,我们可以使用 subplot 方法创建两个轴,其中 nrows=2,ncols=1。这意味着,我们可以有两个索引来绘制所需的图形。我们可以对图形使用 ax1.get_shared_x_axes().join(ax1,ax2) 方法。
步骤
创建两个数字列表。
将子图添加到当前图像中,ax1,其中 nrows = 2,ncols = 1,并且对于 ax1,索引为 1。
将子图添加到当前图像中,ax2,其中 nrows = 2,ncols = 1,并且对于 ax2,索引为 2。
使用在步骤 1 中创建的点绘制 x 和 y。
使用 get_shared_x_axes().join(ax1, ax2),返回一个引用,以共享轴 Grouper 对象作为轴。
使用 set_xticklabels 方法,使用空列表设置网格的 x 轴刻度标签。
使用 plt.show() 来显示图像。
示例
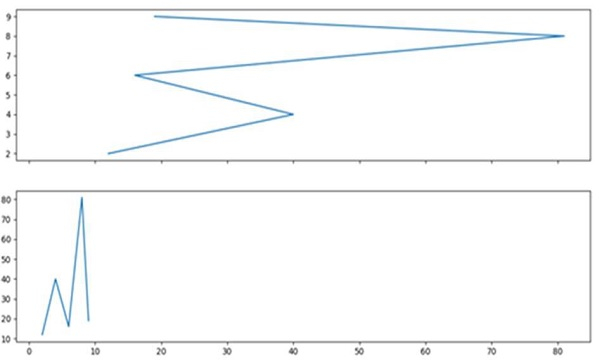
import matplotlib.pyplot as plt

x = [2, 4, 6, 8, 9]
y = [12, 40, 16, 81, 19]

ax1 = plt.subplot(211)
ax2 = plt.subplot(212)

ax1.plot(y, x)
ax2.plot(x, y)

ax1.get_shared_x_axes().join(ax1, ax2)
ax1.set_xticklabels([])

plt.show()
输出

更新于: 15-03-2021
2K+ 查看

广告