
 数据结构
数据结构 网络
网络 关系型数据库管理系统
 操作系统
操作系统 Java
Java iOS
iOS HTML
HTML CSS
CSS Android
 Python
 C 编程
C 编程 C++
C++ C#
C# MongoDB
 MySQL
MySQL Javascript
 PHP
PHP如何在 Tkinter 画布上更新绘图?
创建交互式和动态绘图是使用 Python 开发图形用户界面 (GUI) 的一个重要方面。Tkinter 是 Python 的标准 GUI 工具包,它提供了一个 Canvas 小部件,可以方便地绘制各种形状,包括绘图。
在本文中,我们将探讨在 Tkinter 画布上动态更新绘图的细节。了解此过程对于构建具有实时数据可视化的响应式和用户友好型应用程序至关重要。
设置画布
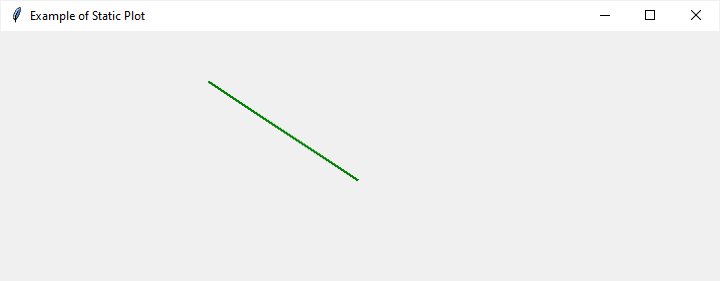
在深入研究动态更新之前,让我们通过创建一个简单的 Tkinter 画布并绘制一个静态绘图来建立基础。Canvas 小部件是允许我们显示和操作图形的关键元素。以下是一个绘制折线图的基本示例:
示例
import tkinter as tk

# Create the main Tkinter window
root = tk.Tk()
root.title("Example of Static Plot")
# Set window dimensions
root.geometry("720x250")

# Create a Canvas widget
canvas = tk.Canvas(root, width=400, height=200)
canvas.pack()

# Coordinates for a simple line plot
x1, y1 = 50, 50
x2, y2 = 200, 150

# Create a line on the canvas
line = canvas.create_line(x1, y1, x2, y2, fill="green", width=2)

# Start the Tkinter event loop
root.mainloop()
以上代码设置了一个带有画布的 Tkinter 窗口,并在其上绘制了一个静态折线图。了解如何创建静态绘图对于我们接下来的示例至关重要。
输出
在本节中,我们将看到三个不同的 Tkinter 画布绘图更新示例。
更新绘图坐标
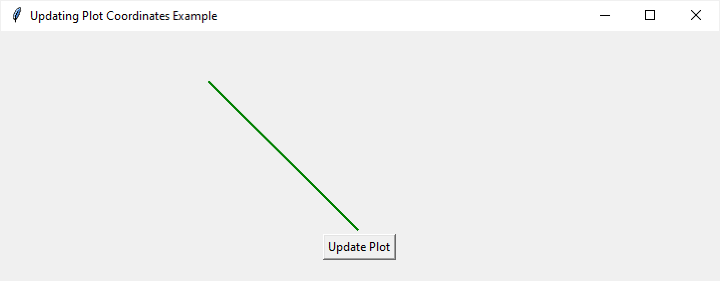
要动态更新绘图,我们需要一种机制来在运行时修改其坐标。canvas.coords 方法允许我们更改画布上项目的坐标。让我们扩展之前的示例,包括一个在按下时更新绘图的按钮:
示例
import tkinter as tk

def update_plot():
   # Update the coordinates of the line
   canvas.coords(line, 10, 10, x2, y2)

   # Change the color of the line
   canvas.itemconfig(line, fill="red")

# Create the main Tkinter window
root = tk.Tk()
root.title("Updating Plot Coordinates Example")
# Set window dimensions
root.geometry("720x250")

# Create a Canvas widget
canvas = tk.Canvas(root, width=400, height=200)
canvas.pack()

# Initial coordinates of the line
x1, y1 = 50, 50
x2, y2 = 200, 200

# Create a line on the canvas
line = canvas.create_line(x1, y1, x2, y2, fill="green", width=2)

# Create a button to trigger the update
update_button = tk.Button(root, text="Update Plot", command=update_plot)
update_button.pack()

# Start the Tkinter event loop
root.mainloop()
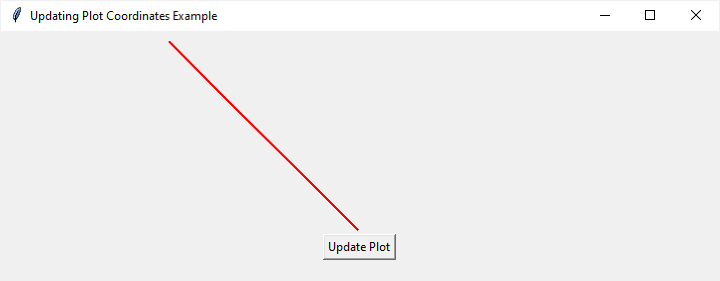
在此示例中,当按下“更新绘图”按钮时,会调用 update_plot 函数。它利用 canvas.coords 修改线条的坐标,有效地更新了绘图。此外,canvas.itemconfig 用于更改线条的颜色。
输出
单击“更新绘图”按钮后,它将如下更改绘图
动画绘图
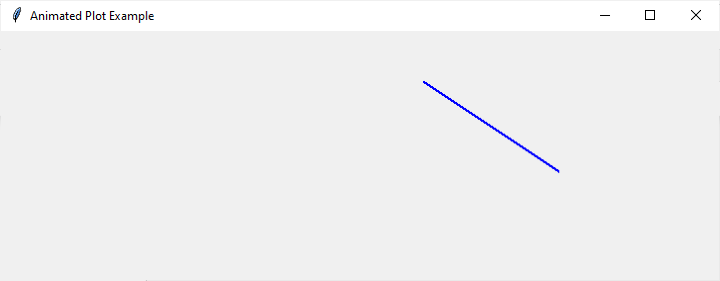
为了创造更具吸引力的用户体验,我们可以为绘图更新引入动画。Tkinter 提供了 after 方法,允许我们安排一个函数在指定时间后被调用。我们可以利用它来创建一个简单的动画,其中绘图逐渐在画布上移动:
示例
import tkinter as tk

def animate_plot():
   global x1, y1, x2, y2

   # Update the coordinates of the line
   canvas.coords(line, x1, y1, x2, y2)

   # Increment the x-coordinates for animation
   x1 += 5
   x2 += 5

   # Schedule the next animation frame
   canvas.after(50, animate_plot)

root = tk.Tk()
root.title("Animated Plot Example")
root.geometry("720x250")

canvas = tk.Canvas(root, width=400, height=200)
canvas.pack()

x1, y1 = 50, 50
x2, y2 = 200, 150

line = canvas.create_line(x1, y1, x2, y2, fill="blue", width=2)
animate_plot()
root.mainloop()
在此示例中,animate_plot 函数会重复调用,每次调用之间延迟 50 毫秒,从而产生流畅的动画效果。在每一帧中,线条的 x 坐标都会递增,导致绘图在画布上水平移动。
输出
更新条形图
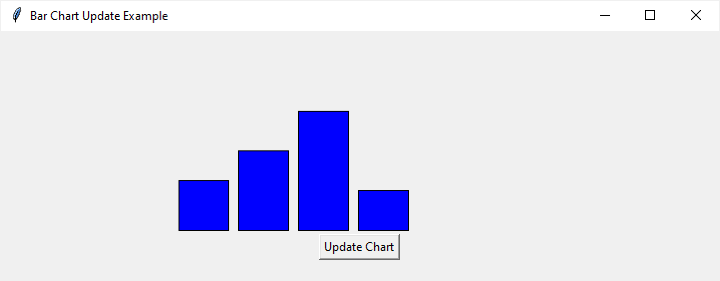
虽然前面的示例侧重于折线图,但更新其他类型的绘图(例如条形图)也遵循类似的方法。让我们创建一个带有条形图的示例,其中单击按钮会更新条形的高度:
示例
import tkinter as tk
import random

def update_chart():
   # Update the heights of the bars with random values
   for i in range(len(bars)):
      new_height = random.randint(10, 150)
      x1, y1, x2, y2 = canvas.coords(bars[i])
      canvas.coords(bars[i], x1, 200 - new_height, x2, 200)

   # Change the color of the bars
   for bar in bars:
      canvas.itemconfig(bar, fill="green")

# Create the main Tkinter window
root = tk.Tk()
root.title("Bar Chart Update Example")
# Set window dimensions
root.geometry("720x250")

# Create a Canvas widget
canvas = tk.Canvas(root, width=400, height=200)
canvas.pack()

# Initial data for the bar chart
bar_data = [50, 80, 120, 40]

# Create bars on the canvas
bars = []
bar_width = 50
for i, height in enumerate(bar_data):
   x1 = i * (bar_width + 10) + 20
   y1 = 200 - height
   x2 = x1 + bar_width
   y2 = 200
   bar = canvas.create_rectangle(x1, y1, x2, y2, fill="blue")
   bars.append(bar)

# Create a button to trigger the update
update_button = tk.Button(root, text="Update Chart", command=update_chart)
update_button.pack()

# Start the Tkinter event loop
root.mainloop()
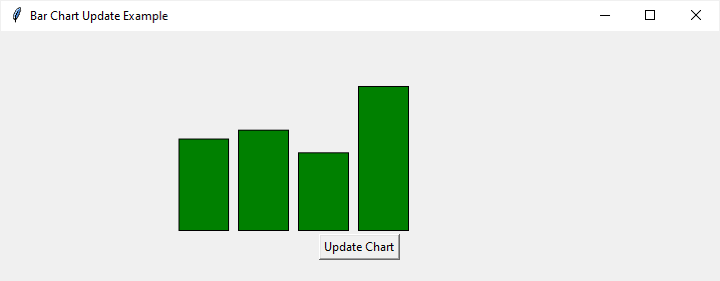
在此示例中,update_chart 函数遍历每个条形,使用随机值更新其高度。然后,canvas.itemconfig 方法用于将每个条形更改为绿色。
输出
单击“更新图表”按钮后,它将如下更改图表:
结论
掌握在 Python 中的 Tkinter 画布上动态更新绘图是一项宝贵的技能,可用于构建交互式和视觉上吸引人的应用程序。我们已经探讨了更新绘图坐标、创建动画以及更新不同类型绘图(如折线图和条形图)的基本概念。
拥有这些知识,开发人员可以通过提供实时数据可视化和创建响应式 GUI 来增强用户体验。随着您继续使用 Tkinter 和画布,尝试这些概念将为更高级和更复杂的图形应用程序打开大门。

2K+ 次查看
