
 数据结构
数据结构 网络
网络 RDBMS
RDBMS 操作系统
操作系统 Java
Java iOS
iOS HTML
HTML CSS
CSS Android
 Python
 C 编程
C 编程 C++
C++ C#
C# MongoDB
 MySQL
MySQL Javascript
 PHP
PHP如何在 matplotlib 中使用 ax.get_ylim()?
要在 matplotlib 中使用 ax.get_ylim() 方法,我们可以采取以下步骤。
步骤
设置图形大小并调整子图之间的内边距和周围的边距。
创建新的图形或激活现有的图形。
作为子图排列的一部分,向图形添加“ax”。
使用 numpy 创建随机数据点。
使用 plot() 方法绘制 y 数据点。
使用 ax.get_ylim() 方法打印它。
要显示图像,请使用 Show() 方法。
示例
import numpy as np
from matplotlib import pyplot as plt

plt.rcParams["figure.figsize"] = [7.00, 3.50]
plt.rcParams["figure.autolayout"] = True

fig = plt.figure()

# Add an axes to the figure
ax = fig.add_subplot(1, 1, 1)

# Create random data points using numpy
y = np.random.rand(10)

# Plot the data points
ax.plot(y, 'b')

# Print the data points using ax.get_ylim
print("ylim:", ax.get_ylim())

plt.show()
输出
它会产生以下输出 -
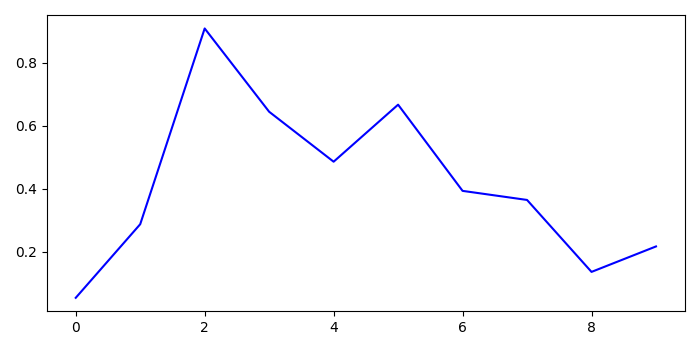
在控制台中,你会得到 ylim 的值 -
ylim: (0.011546568085342858, 1.0373520884865295)

更新时间: 2021 年 10 月 8 日
502 次浏览

广告