
 数据结构
数据结构 网络
网络 关系型数据库管理系统
 操作系统
操作系统 Java
Java iOS
iOS HTML
HTML CSS
CSS Android
 Python
 C 编程
C 编程 C++
C++ C#
C# MongoDB
 MySQL
MySQL Javascript
 PHP
PHP在 Python 中实现均值漂移算法
机器学习中存在许多类型的聚类算法。这些算法可以在 Python 中实现。在本文中,让我们讨论并使用 Python 实现“均值漂移”算法。它是一种用作无监督学习方法的聚类算法。
在此算法中,没有做出任何假设。这意味着它是一种非参数算法。该算法通过迭代方式将数据点分配到某些集群,这是通过将这些数据点移向数据点密度最高的位置来完成的。
数据点的高密度被称为集群的质心。均值漂移算法和 K 均值聚类之间的区别在于,在前者(K 均值)中,需要提前指定集群的数量。
这是因为集群的数量是根据现有数据使用 K 均值算法找到的。
让我们了解均值漂移算法中的步骤 -
数据点被分配到它自己的集群。
然后,确定这些集群的质心。
这些质心的位置被迭代更新。
接下来,该过程移动到更高密度的区域。
一旦质心到达无法进一步移动的位置,该过程就会停止。
让我们了解如何使用 scikit-learn 在 Python 中实现它 -
示例
import numpy as np
from sklearn.cluster import MeanShift
import matplotlib.pyplot as plt
from matplotlib import style
style.use("ggplot")
from sklearn.datasets.samples_generator import make_blobs
centers = [[3,3,1],[4,5,5],[11,10,10]]
X, _ = make_blobs(n_samples = 950, centers = centers, cluster_std = 0.89)
plt.title("Implementation of Mean-Shift algorithm")
plt.xlabel("X-axis")
plt.ylabel("Y-axis")
plt.scatter(X[:,0],X[:,1])
plt.show()
ms = MeanShift()
ms.fit(X)
labels = ms.labels_
clusterCent = ms.cluster_centers_
print(clusterCent)
numCluster = len(np.unique(labels))
print("Estimated clusters:", numCluster)
colors = 10*['r.','g.','b.','c.','k.','y.','m.']
for i in range(len(X)):
plt.plot(X[i][0], X[i][1], colors[labels[i]], markersize = 3)
plt.scatter(clusterCent[:,0],clusterCent[:,1],
marker=".",color='k', s=20, linewidths = 5, zorder=10)
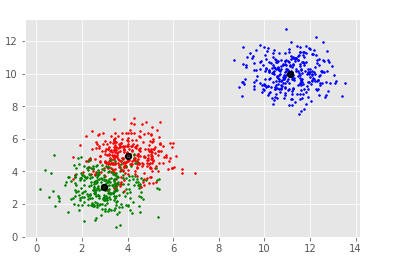
plt.show()输出

[[ 3.05250924 3.03734994 1.06159541]
[ 3.92913017 4.99956874 4.86668482]
[10.99127523 10.02361122 10.00084718]]
Estimated clusters: 3
解释
导入所需的包并为其定义别名以方便使用。
将“ggplot”指定给“style”类中存在的“use”函数。
使用“make_blobs”函数创建数据集群。
使用 set_xlabel、set_ylabel 和 set_title 函数为“X”轴、“Y”轴和标题提供标签。
调用“MeanShift”函数,并将其分配给一个变量。
将数据拟合到模型。
定义标签和集群数量。
绘制此数据,并显示拟合到模型的数据的散点图。
使用“show”函数在控制台上显示。

更新于: 2021年1月18日
388 次查看

广告