
 数据结构
数据结构 网络
网络 RDBMS
RDBMS 操作系统
操作系统 Java
Java iOS
iOS HTML
HTML CSS
CSS Android
 Python
 C 编程
C 编程 C++
C++ C#
C# MongoDB
 MySQL
MySQL Javascript
 PHP
PHPMatplotlib - plt.subplots() 和 plt.figure() 之间
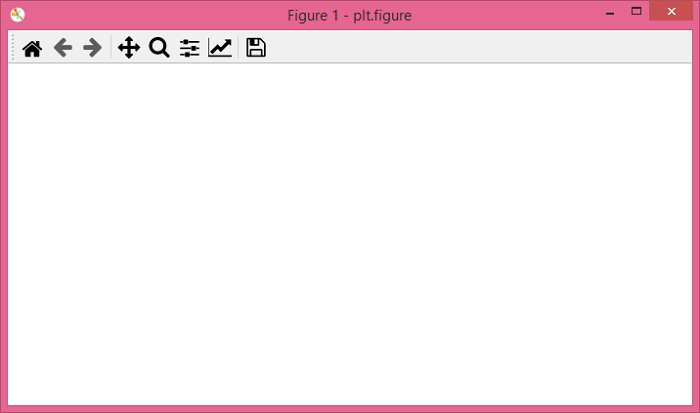
plt.figure() - 创建一个新图形或激活一个现有的图形。
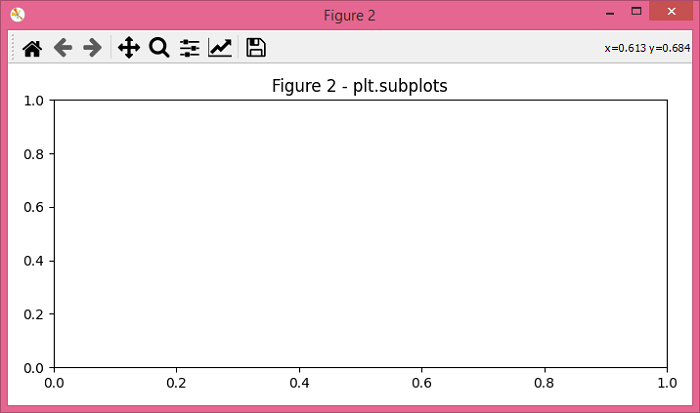
plt.subplots() - 创建一个图形和一组子图。
我们举一个例子来了解 plt.subplots() 和 plt.figure() 之间的区别。
步骤
设置图形大小并调整子图之间和周围的间距。
创建一个新图形或激活一个现有的图形。使用 plt.figure() 方法。
创建一个图形和一组子图。使用 plt.subplots() 方法。
要显示图形,请使用 Show() 方法。
实例
from matplotlib import pyplot as plt

# Set the figure size
plt.rcParams["figure.figsize"] = [7.00, 3.50]
plt.rcParams["figure.autolayout"] = True

# Create a new figure using plt.figure
fig1 = plt.figure("Figure 1 - plt.figure")

# Create a figure and set of subplots using plt.subplots
fig2, ax = plt.subplots()
plt.title("Figure 2 - plt.subplots")

# Display the plot
plt.show()
输出
plt.figure() 产生以下输出
而 plt.subplots() 产生以下输出 -

更新于: 2021-10-11
2K+ 浏览

广告