Python 网络分析
网络是由节点和边组成的集合,这些节点和边表示这些节点之间的关系或连接。节点可以表示各种实体,例如个人、组织、基因或网站,而边则表示它们之间的连接或交互。
网络分析是对这些实体之间关系的研究,节点表示为网络。在这篇文章中,我们将了解如何使用 python 实现网络分析。它涉及使用许多数学、统计和计算技术。网络分析可以提供对复杂系统行为的见解,并帮助在各个领域做出明智的决策。
Python 为我们提供了一个名为 networkx 的包,它对创建、操作和分析复杂网络非常有帮助。在继续本文之前,我们将使用以下命令在终端中安装 networkx 用于 python 中的网络分析
pip install networkx
创建简单图
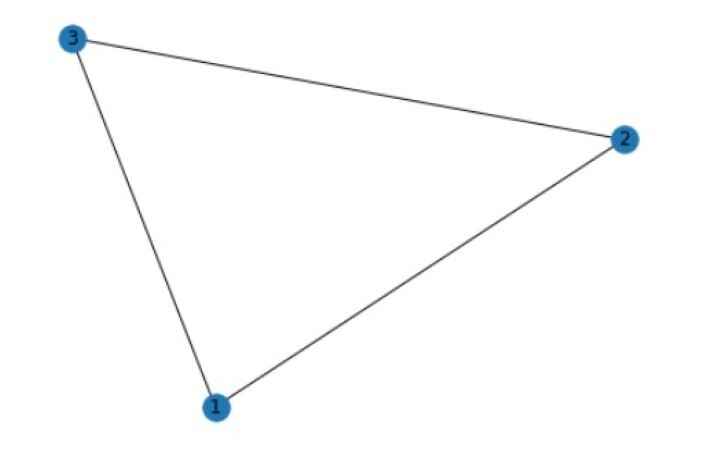
在这里,我们将使用 networkx 库创建一个简单图。它将包含 3 个节点和 3 条边。然后,我们将计算每个节点的度数和聚类系数,最后绘制图形。
节点的度数:节点在图中拥有的邻居数。可以通过计算连接到节点的边的数量来计算。
聚类系数:衡量节点的邻居彼此连接程度的指标。换句话说,它是衡量图中围绕特定节点的局部连接密度的指标。它是通过将节点的邻居之间存在的边的数量除以此类边的最大可能数量来计算的。
示例
import networkx as nx
import matplotlib.pyplot as plt

# create an empty graph
G = nx.Graph()

# add nodes
G.add_node(1)
G.add_node(2)
G.add_node(3)

# add edges
G.add_edge(1, 2)
G.add_edge(2, 3)
G.add_edge(3, 1)

print("Node degree:")
for node in G.nodes():
   print(f"{node}: {G.degree(node)}")
# clustering coefficient
print("Node clustering coefficient:")
for node in G.nodes():
   print(f"{node}: {nx.clustering(G, node)}")
# draw the graph
nx.draw(G, with_labels=True)
plt.show()
输出
Node degree:
1: 2
2: 2
3: 2
Node clustering coefficient:
1: 1.0
2: 1.0
3: 1.0

识别社区
识别图中的社区是根据相似特征将图的节点划分为组或集群的过程。为此,使用 Louvain 算法。它是一种迭代算法,通过优化衡量给定社区结构模块性的质量函数来工作。模块性衡量社区内边的数量与随机图中预期边的数量相比的高低程度。
Louvain 算法分两个阶段工作,分别是
该算法将每个节点分配到自己的社区。然后迭代地在社区之间移动节点,以便可以提高模块性。此过程不断重复,直到没有改进模块性的空间。
然后,该算法构建新的图,每个节点代表第一阶段中的一个社区。边表示社区之间边的总权重。最后,将第一阶段应用于此新图,以帮助识别更粗粒度的社区。
Louvain 算法非常高效,可用于检测具有数百万个节点和边的庞大图中的社区。
示例
import networkx as nx
import matplotlib.pyplot as plt

G = nx.gnm_random_graph(7,10)

# draw the graph
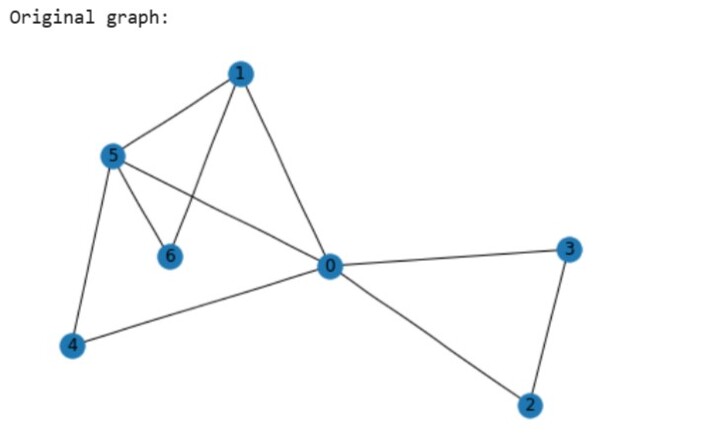
print("Original graph:")
nx.draw(G,with_labels=True)
plt.show()

print("Node degree:")
for node in G.nodes():
   print(f"{node}: {G.degree(node)}")

print("Node betweenness centrality:")
bc = nx.betweenness_centrality(G)
for node in bc:
   print(f"{node}: {bc[node]}")

# community identification using Louvain algorithm
communities = nx.algorithms.community.modularity_max.greedy_modularity_communities(G)

# print the communities and the number of nodes in each community
i = 1
for c in communities:
   print(f"Community {i}: {c}")
   i += 1
   print(f"Number of nodes: {len(c)}")

color_map = []
for node in G.nodes():
   for i in range(len(communities)):
      if node in communities[i]:
         color_map.append(i)

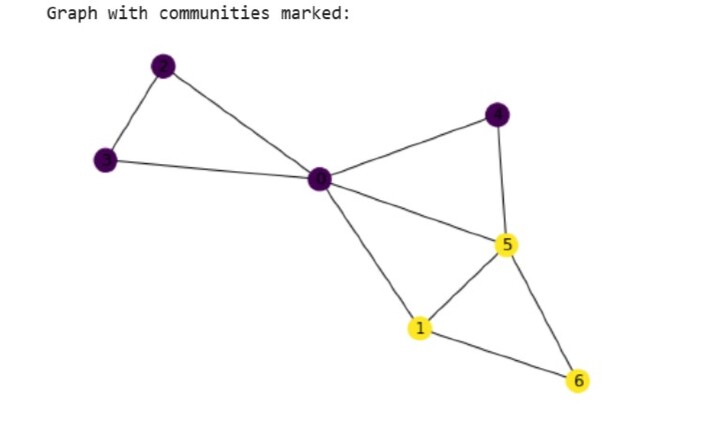
print("Graph with communities marked:")

nx.draw(G, node_color=color_map, with_labels=True)
plt.show()
输出

Node degree:
0: 5
1: 3
2: 2
3: 2
4: 2
5: 4
6: 2
Node betweenness centrality:
0: 0.5666666666666667
1: 0.1
2: 0.0
3: 0.0
4: 0.0
5: 0.2
6: 0.0
Community 1: frozenset({0, 2, 3, 4})
Number of nodes: 4
Community 2: frozenset({1, 5, 6})
Number of nodes: 3

分析同质性
同质性是个人与拥有与自己相似特征或倾向的其他个人(如信仰、价值观或人口统计信息,如年龄、性别、种族等)交往的趋势。
这是一个有据可查的社会现象,有助于网络分析。
我们将研究同质性在塑造网络结构中的作用,包括相似节点彼此连接的趋势。
图的同质性系数衡量这种相似节点连接的趋势,它是借助 nx.attribute_assortativity_coefficient() 函数计算的,范围从 -1 到 1。正值表示可能性更大,而负值表示可能性更小。
在下面的代码中,我们不仅计算了同质性系数,还通过为每个节点分配一个二元属性“类型”来标记节点,以指示它属于 A 组还是 B 组。我们还根据其类型绘制了节点颜色的图形,以可视化任何同质性模式。
示例
import networkx as nx
import matplotlib.pyplot as plt

G = nx.gnm_random_graph(50, 100)

# binary attributes for each node for indication of it’s type
for node in G.nodes():
   G.nodes[node]['type'] = 'A' if node < 25 else 'B'

# draw the graph and colour the nodes with their corresponding types A or B
color_map = ['red' if G.nodes[node]['type'] == 'A' else 'blue' for node in G.nodes()]
nx.draw(G, node_color=color_map, with_labels=True)
plt.show()

homophily_coeff = nx.attribute_assortativity_coefficient(G, 'type')
print(f"Homophily coefficient: {homophily_coeff}")
输出

Homophily coefficient: -0.0843989769820972
结论
网络分析对于研究复杂系统的结构和动态(包括社交网络)非常有用。Python 提供了各种库来做到这一点,但是 networkx 是最常用的库。通过使用 python 中的网络分析,研究人员和分析师可以回答各种研究问题,例如识别关键节点和社区、衡量网络的稳健性和弹性、检测同质性和社会影响的模式。虽然网络分析可能是一个复杂的专业领域,但如果仔细关注数据准备和清理,它可以帮助解决大量现实世界的问题,并帮助企业发展。


 数据结构
数据结构 网络
网络 关系型数据库管理系统
 操作系统
操作系统 Java
Java iOS
iOS HTML
HTML CSS
CSS Android
 Python
 C 编程
C 编程 C++
C++ C#
C# MongoDB
 MySQL
MySQL Javascript
 PHP
PHP