
 数据结构
数据结构 网络
网络 RDBMS
RDBMS 操作系统
操作系统 Java
Java iOS
iOS HTML
HTML CSS
CSS Android
 Python
 C编程
C编程 C++
C++ C#
C# MongoDB
 MySQL
MySQL Javascript
 PHP
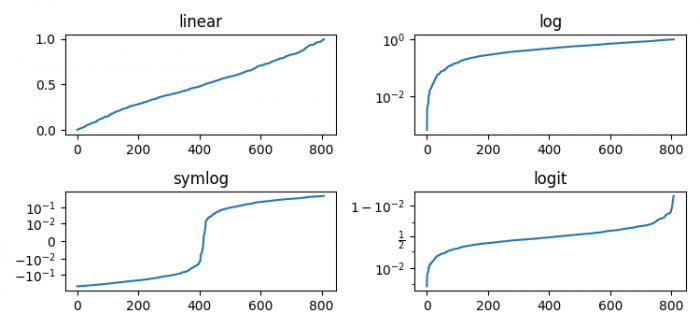
PHP在Matplotlib中按照名称绘制比例尺类别线性和对数、逻辑和对数对称?
要按照名称绘制带有类别的yscale,我们可以按以下步骤操作:
- 设置图形大小并调整子图的内外边距。
- 使用Numpy创建y数据点。
- 使用Numpy创建x数据点。
- 在索引1处向当前图像添加子图。
- 使用plot()方法绘制x和y数据点。
- 对于按名称分级的线性类,使用yscale("linear")方法。
- 设置当前子图的标题。从4到5步骤重复上述操作,使用不同的索引、按名称分级的yscale()和绘图标题。
- 要显示图像,请使用show()方法。
示例
import numpy as np
import matplotlib.pyplot as plt
plt.rcParams["figure.figsize"] = [7.50, 3.50]
plt.rcParams["figure.autolayout"] = True
y = np.random.normal(loc=0.5, scale=0.4, size=1000)
y = y[(y > 0) & (y < 1)]
y.sort()
x = np.arange(len(y))

# linear
plt.subplot(221)
plt.plot(x, y)
plt.yscale('linear')
plt.title('linear')

# log
plt.subplot(222)
plt.plot(x, y)
plt.yscale('log')
plt.title('log')

# symmetric log
plt.subplot(223)
plt.plot(x, y - y.mean())
plt.yscale('symlog', linthreshy=0.01)
plt.title('symlog')

# logit
plt.subplot(224)
plt.plot(x, y)
plt.yscale('logit')
plt.title('logit')
plt.show()
输出

更新日期:2021年6月2日
448 次查看

广告