
 数据结构
数据结构 网络
网络 关系型数据库管理系统
 操作系统
操作系统 Java
Java iOS
iOS HTML
HTML CSS
CSS Android
 Python
 C 编程
C 编程 C++
C++ C#
C# MongoDB
 MySQL
MySQL Javascript
 PHP
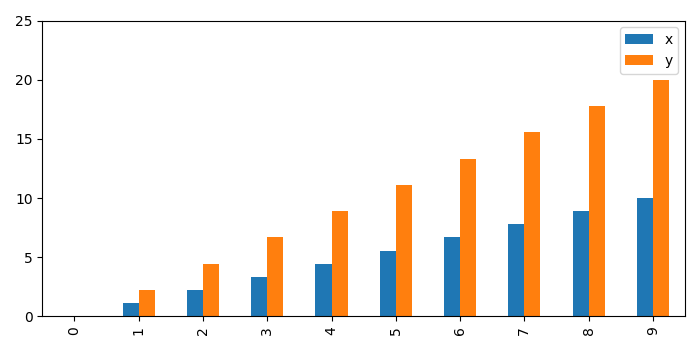
PHP使用 Pandas 在 Matplotlib 中设置 Y 轴
若要使用 Pandas 在 matplotlib 中设置 Y 轴,我们可以按以下步骤进行 −
创建一个字典,键为x 和y。
使用 Pandas 创建一个数据框架。
使用 Pandas plot 绘制数据点,参数为 ylim(0, 25) 和 xlim(0, 15)。
要显示图形,可以使用show() 方法。
示例
import numpy as np
import pandas as pd
from matplotlib import pyplot as plt
plt.rcParams["figure.figsize"] = [7.00, 3.50]
plt.rcParams["figure.autolayout"] = True
d = dict(
   x=np.linspace(0, 10, 10),
   y=np.linspace(0, 10, 10)*2
)
df = pd.DataFrame(d)
df.plot(kind="bar", ylim=(0, 25), xlim=(0, 15))
plt.show()
输出

更新时间:2021 年 5 月 6 日
6000+ 次浏览

广告