使用 ELK 和 Sleuth 进行分布式日志记录
简介
在分布式环境或单体环境中,应用程序日志对于调试任何错误都至关重要。在本节中,我们将探讨如何有效地记录日志并改进跟踪能力,以便我们能够轻松查看日志。
日志模式对日志记录至关重要的两个主要原因:
服务间调用 - 在微服务架构中,服务之间存在异步和同步调用。链接这些请求至关重要,因为单个请求可能存在多级嵌套。
服务内调用 - 单个服务接收多个请求,它们的日志很容易混杂在一起。因此,为请求关联一些 ID 对于过滤请求的所有日志变得很重要。
Sleuth 是一个用于应用程序日志记录的知名工具,而 ELK 用于更简单的系统级观测。
依赖设置
让我们使用我们在每一章中都用到的餐厅案例。假设我们有客户服务和餐厅服务通过 API(即同步通信)进行通信。我们希望使用 Sleuth 来跟踪请求,并使用 ELK 堆栈进行集中可视化。
为此,首先设置 ELK 堆栈。为此,我们将使用 Docker 容器启动 ELK 堆栈。以下是我们可以考虑的镜像:
完成 ELK 设置后,通过访问以下 API 来确保其按预期工作:
Elasticsearch − localhost:9200
Kibana − localhost:5601
我们将在本节末尾查看 Logstash 配置文件。
然后,让我们将以下依赖项添加到我们的客户服务和餐厅服务:
<dependency>
      <groupId>org.springframework.cloud</groupId>
      <artifactId>spring-cloud-starter-sleuth</artifactId>
</dependency>
现在我们已经设置了依赖项并运行了 ELK,让我们转到核心示例。
服务内部的请求跟踪
在最基本的层面上,Sleuth 添加了以下元数据:
服务名称 - 当前正在处理请求的服务。
跟踪 ID - 将一个元数据 ID 添加到日志中,该 ID 会在服务之间发送以处理输入请求。这对于服务间通信非常有用,用于对处理一个输入请求的所有内部请求进行分组。
跨度 ID - 将一个元数据 ID 添加到日志中,该 ID 在服务为处理请求而记录的所有日志语句中都是相同的。它对服务内日志很有用。请注意,对于父服务,跨度 ID = 跟踪 ID。
让我们看看它的实际效果。为此,让我们更新我们的客户服务代码以包含日志行。以下是我们将使用的控制器代码。
package com.tutorialspoint;
import java.util.HashMap;
import org.slf4j.Logger;
import org.slf4j.LoggerFactory;
import org.springframework.beans.factory.annotation.Autowired;
import org.springframework.messaging.Message;
import org.springframework.web.bind.annotation.PathVariable;
import org.springframework.web.bind.annotation.RequestMapping;
import org.springframework.web.bind.annotation.RequestMethod;
import org.springframework.web.bind.annotation.RestController;
@RestController
class RestaurantCustomerInstancesController {
   Logger logger =
LoggerFactory.getLogger(RestaurantCustomerInstancesController.class);
   static HashMap<Long, Customer> mockCustomerData = new HashMap();
   static{
      mockCustomerData.put(1L, new Customer(1, "Jane", "DC"));
      mockCustomerData.put(2L, new Customer(2, "John", "SFO"));
      mockCustomerData.put(3L, new Customer(3, "Kate", "NY"));
   }
   @RequestMapping("/customer/{id}")
   public Customer getCustomerInfo(@PathVariable("id") Long id) {
      logger.info("Querying customer with id: " + id);
      Customer customer = mockCustomerData.get(id);
      if(customer != null) {
         logger.info("Found Customer: " + customer);
      }
      return customer;
   }
}
现在让我们执行代码,像往常一样,启动 Eureka 服务器。请注意,这不是硬性要求,这里是为了完整性。
然后,让我们使用以下命令编译并启动更新后的客户服务:
mvn clean install ; java -Dapp_port=8083 -jar .\target\spring-cloud-eurekaclient-
1.0.jar
我们准备好了,现在让我们通过访问 API 来测试我们的代码片段:
curl -X GET https://:8083/customer/1
以下是我们将为此 API 获取的输出:
{
   "id": 1,
   "name": "Jane",
   "city": "DC"
}
现在让我们检查客户服务的日志:
2021-03-23 13:46:59.604 INFO [customerservice,
b63d4d0c733cc675,b63d4d0c733cc675] 11860 --- [nio-8083-exec-7]
.t.RestaurantCustomerInstancesController : Querying customer with id: 1
2021-03-23 13:46:59.605 INFO [customerservice,
b63d4d0c733cc675,b63d4d0c733cc675] 11860 --- [nio-8083-exec-7]
.t.RestaurantCustomerInstancesController : Found Customer: Customer [id=1,
name=Jane, city=DC]
…..
因此,有效地,正如我们所看到的,我们在日志语句中添加了服务名称、跟踪 ID 和跨度 ID。
跨服务的请求跟踪
让我们看看如何跨服务进行日志记录和跟踪。例如,我们将使用内部调用客户服务的餐厅服务。
为此,让我们更新我们的餐厅服务代码以包含日志行。以下是我们将使用的控制器代码。
package com.tutorialspoint;
import java.util.HashMap;
import java.util.List;
import java.util.function.Consumer;
import java.util.function.Supplier;
import java.util.stream.Collectors;
import org.slf4j.Logger;
import org.slf4j.LoggerFactory;
import org.springframework.beans.factory.annotation.Autowired;
import org.springframework.context.annotation.Bean;
import org.springframework.web.bind.annotation.PathVariable;
import org.springframework.web.bind.annotation.RequestMapping;
import org.springframework.web.bind.annotation.RestController;
@RestController
class RestaurantController {
   @Autowired
   CustomerService customerService;
   Logger logger = LoggerFactory.getLogger(RestaurantController.class);
   static HashMap<Long, Restaurant> mockRestaurantData = new HashMap();
   static{
      mockRestaurantData.put(1L, new Restaurant(1, "Pandas", "DC"));
      mockRestaurantData.put(2L, new Restaurant(2, "Indies", "SFO"));
      mockRestaurantData.put(3L, new Restaurant(3, "Little Italy", "DC"));
      mockRestaurantData.put(4L, new Restaurant(4, "Pizeeria", "NY"));
   }
   @RequestMapping("/restaurant/customer/{id}")
   public List<Restaurant> getRestaurantForCustomer(@PathVariable("id") Long id) {
      logger.info("Get Customer from Customer Service with customer id: " + id);
      Customer customer = customerService.getCustomerById(id);
      logger.info("Found following customer: " + customer);
      String customerCity = customer.getCity();
      return mockRestaurantData.entrySet().stream().filter(
      entry -> entry.getValue().getCity().equals(customerCity))
      .map(entry -> entry.getValue())
      .collect(Collectors.toList());
   }
}
让我们使用以下命令编译并启动更新后的餐厅服务:
mvn clean install; java -Dapp_port=8082 -jar .\target\spring-cloud-feign-client-1.0.jar
确保我们已运行 Eureka 服务器和客户服务。我们准备好了,现在让我们通过访问 API 来测试我们的代码片段:
curl -X GET https://:8082/restaurant/customer/2
以下是我们将为此 API 获取的输出:
[
   {
      "id": 2,
      "name": "Indies",
      "city": "SFO"
   }
]
现在,让我们检查餐厅服务的日志:
2021-03-23 14:44:29.381 INFO [restaurantservice,
6e0c5b2a4fc533f8,6e0c5b2a4fc533f8] 19600 --- [nio-8082-exec-6]
com.tutorialspoint.RestaurantController : Get Customer from Customer Service
with customer id: 2
2021-03-23 14:44:29.400 INFO [restaurantservice,
6e0c5b2a4fc533f8,6e0c5b2a4fc533f8] 19600 --- [nio-8082-exec-6]
com.tutorialspoint.RestaurantController : Found following customer: Customer
[id=2, name=John, city=SFO]
然后,让我们检查客户服务的日志:
2021-03-23 14:44:29.392 INFO [customerservice,
6e0c5b2a4fc533f8,f2806826ac76d816] 11860 --- [io-8083-exec-10]
.t.RestaurantCustomerInstancesController : Querying customer with id: 2
2021-03-23 14:44:29.392 INFO [customerservice,
6e0c5b2a4fc533f8,f2806826ac76d816] 11860 --- [io-8083-exec-10]
.t.RestaurantCustomerInstancesController : Found Customer: Customer [id=2,
name=John, city=SFO]…..
因此,有效地,正如我们所看到的,我们在日志语句中添加了服务名称、跟踪 ID 和跨度 ID。此外,我们看到跟踪 ID,即 6e0c5b2a4fc533f8 在客户服务和餐厅服务中重复出现。
使用 ELK 进行集中式日志记录
到目前为止,我们看到的是通过 Sleuth 来改进我们的日志记录和跟踪能力的一种方法。但是,在微服务架构中,我们有多个服务运行,并且每个服务有多个实例运行。查看每个实例的日志以识别请求流是不切实际的。这就是 ELK 对我们有帮助的地方。
让我们使用与 Sleuth 相同的服务间通信案例。让我们更新我们的餐厅和客户服务以添加logback 附加器用于 ELK 堆栈。
在继续之前,请确保已设置 ELK 堆栈并且可以在 localhost:5601 访问 Kibana。此外,请使用以下设置配置 Lostash 配置:
input {
   tcp {
      port => 8089
      codec => json
   }
}
output {
   elasticsearch {
      index => "restaurant"
      hosts => ["https://:9200"]
   }
}
完成此操作后,我们需要执行两个步骤才能在我们的 Spring 应用程序中使用 Logstash。我们将为我们的两个服务执行以下步骤。首先,添加 logback 的依赖项以使用 Logstash 的附加器。
<dependency>
<groupId>net.logstash.logback</groupId>
   <artifactId>logstash-logback-encoder</artifactId>
   <version>6.6</version>
</dependency>
其次,为 logback 添加一个附加器,以便 logback 可以使用此附加器将数据发送到 Logstash
<?xml version="1.0" encoding="UTF-8"?>
<configuration>
   <appender name="logStash"
class="net.logstash.logback.appender.LogstashTcpSocketAppender">
      <destination>10.24.220.239:8089</destination>
      <encoder class="net.logstash.logback.encoder.LogstashEncoder" />
   </appender>
   <appender name="console" class="ch.qos.logback.core.ConsoleAppender">
      <encoder>
         <pattern>%d{HH:mm:ss.SSS} [%thread] %-5level %logger{36} -
%msg%n</pattern>
      </encoder>
   </appender>
   <root level="INFO">
      <appender-ref ref="logStash" />
      <appender-ref ref="console" />
   </root>
</configuration>
上面的附加器将记录到控制台,并将日志发送到 Logstash。现在,完成此操作后,我们就可以测试了。
现在,让我们像往常一样执行上述代码,启动 Eureka 服务器。
然后,让我们使用以下命令编译并启动更新后的客户服务:
mvn clean install ; java -Dapp_port=8083 -jar .\target\spring-cloud-eurekaclient- 1.0.jar
然后,让我们使用以下命令编译并启动更新后的餐厅服务:
mvn clean install; java -Dapp_port=8082 -jar .\target\spring-cloud-feign-client- 1.0.jar
我们准备好了,现在让我们通过访问 API 来测试我们的代码片段:
curl -X GET https://:8082/restaurant/customer/2
以下是我们将为此 API 获取的输出:
[
   {
      "id": 2,
      "name": "Indies",
      "city": "SFO"
   }
]
但更重要的是,日志语句也将显示在 Kibana 上。
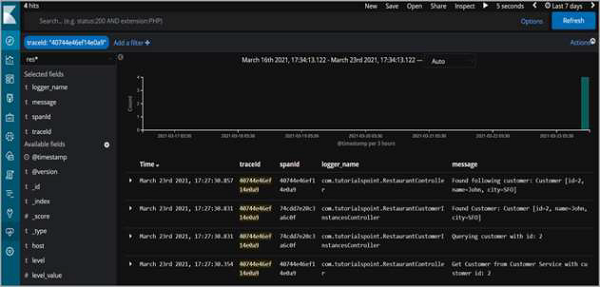
因此,正如我们所看到的,我们可以按跟踪 ID进行筛选,并查看跨服务记录的所有日志语句,这些语句是为了完成请求而记录的。