
 数据结构
数据结构 网络
网络 关系数据库管理系统
 操作系统
操作系统 Java
Java iOS
iOS HTML
HTML CSS
CSS Android
 Python
 C 语言编程
 C++
C++ C#
C# MongoDB
 MySQL
MySQL Javascript
 PHP
PHPSeaborn 中有哪些不同的图形样式?
Seaborn 是 Python 中一个强大的数据可视化库,它提供了各种样式来自定义绘图的外观。Seaborn 中内置的图形样式可以帮助我们自定义绘图的外观,并增强可视化的美观性。让我们逐一探索 Seaborn 中可用的不同图形样式。
Seaborn 中有不同的图形样式,它们是:
默认样式
深色网格样式
白色网格样式
深色样式
白色样式
刻度样式
当我们想要在 Seaborn 中应用特定样式时,可以使用 'set_style()' 函数。例如,要设置深色网格样式,我们可以使用 'seaborn.set_style("darkgrid")'。默认情况下,样式会应用于所有后续绘图,但我们也可以使用 'with' 语句将特定样式临时应用于单个绘图。
除了内置的图形样式外,Seaborn 还允许使用 'set()' 函数进一步自定义绘图。使用 'set()',我们可以修改绘图的各个方面,例如调色板、字体大小和网格样式,以满足我们的偏好和需求。
默认样式
Seaborn 的默认样式设计为视觉上具有吸引力并优化了可读性。它具有简洁现代的外观,带有中等灰色的网格线和白色背景。此样式是在使用 Seaborn 创建绘图时应用的默认样式。
示例
以下是一个使用默认样式创建 Seaborn 绘图的示例:
import seaborn as sns
import matplotlib.pyplot as plt

# Generate some random data for plotting
x = [1, 2, 3, 4, 5]
y = [2, 4, 6, 8, 10]

# Plot a box plot using the ticks style
plt.boxplot(y)
plt.title("Box Plot with default Style")
plt.show()
输出

深色网格样式
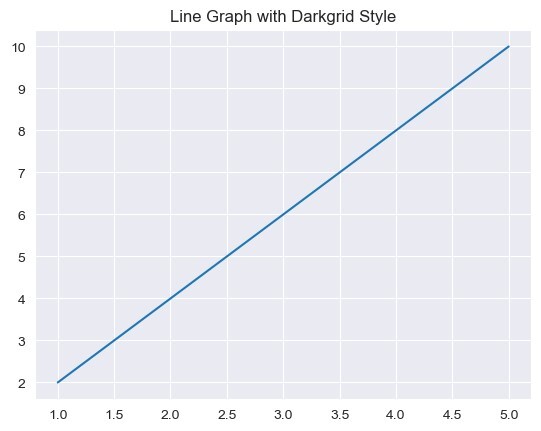
深色网格样式的特点是深色背景和网格线。它适用于需要高对比度的绘图,使数据更容易聚焦。此样式通过设置深灰色背景颜色和浅灰色网格线来实现。
示例
以下是一个示例:
import seaborn as sns
import matplotlib.pyplot as plt

# Generate some random data for plotting
x = [1, 2, 3, 4, 5]
y = [2, 4, 6, 8, 10]

# Set the style to "darkgrid"
sns.set_style("darkgrid")

# Plot a line graph using the darkgrid style
plt.plot(x, y)
plt.title("Line Graph with Darkgrid Style")
plt.show()
输出
白色网格样式
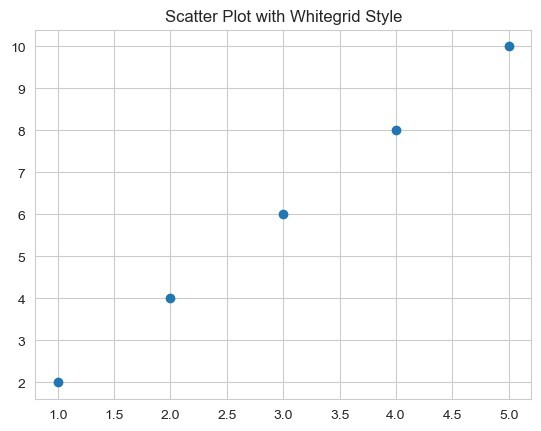
白色网格样式类似于深色网格样式,但具有白色背景。它将简洁的外观与网格线相结合,允许数据点之间清晰的视觉分离。当我们想要强调数据同时保持结构化布局时,此样式很有用。
示例
以下是一个示例:
import seaborn as sns
import matplotlib.pyplot as plt

# Generate some random data for plotting
x = [1, 2, 3, 4, 5]
y = [2, 4, 6, 8, 10]

# Set the style to "whitegrid"
sns.set_style("whitegrid")

# Plot a scatter plot using the whitegrid style
plt.scatter(x, y)
plt.title("Scatter Plot with Whitegrid Style")
plt.show()
输出
深色样式
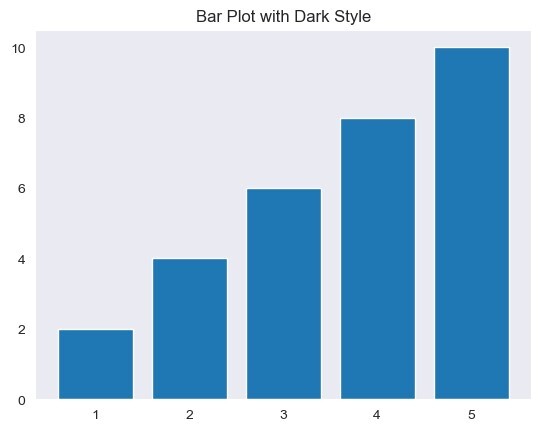
深色样式提供深色背景,没有网格线。它适用于创建具有现代和简约外观的绘图。此样式通过设置深灰色背景颜色并移除网格线来实现。
示例
在以下示例中,我们尝试使用深色样式创建 Seaborn 绘图:
import seaborn as sns
import matplotlib.pyplot as plt

# Generate some random data for plotting
x = [1, 2, 3, 4, 5]
y = [2, 4, 6, 8, 10]

# Set the style to "dark"
sns.set_style("dark")

# Plot a bar plot using the dark style
plt.bar(x, y)
plt.title("Bar Plot with Dark Style")
plt.show()
输出
白色样式
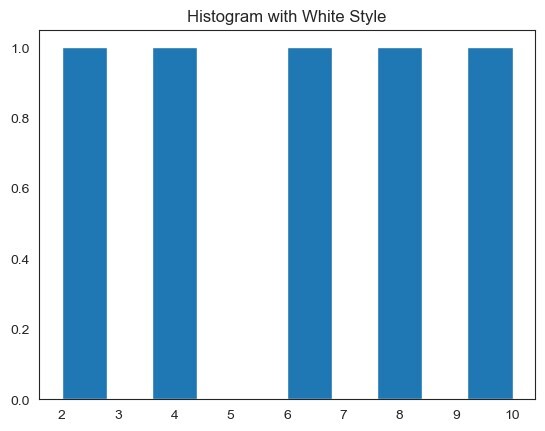
白色样式具有白色背景,没有网格线。它创建了一个简单干净的外观,适用于以数据本身为焦点的绘图。此样式通过设置白色背景颜色并移除网格线来实现。
示例
让我们看一个例子:
import seaborn as sns
import matplotlib.pyplot as plt

# Generate some random data for plotting
x = [1, 2, 3, 4, 5]
y = [2, 4, 6, 8, 10]

# Set the style to "white"
sns.set_style("white")

# Plot a histogram using the white style
plt.hist(y)
plt.title("Histogram with White Style")
plt.show()
输出
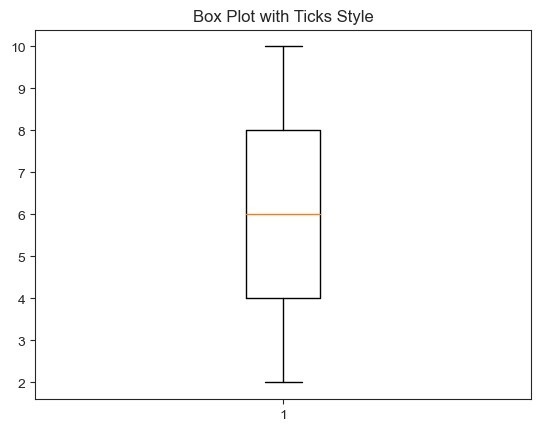
刻度样式
刻度样式会移除绘图的顶部和右侧脊柱,并且只保留剩余脊柱上的刻度。此样式通过减少杂乱来简化绘图的外观,同时仍然提供必要的轴信息。
示例
以下是一个示例:
import seaborn as sns
import matplotlib.pyplot as plt

# Generate some random data for plotting
x = [1, 2, 3, 4, 5]
y = [2, 4, 6, 8, 10]

# Set the style to "ticks"
sns.set_style("ticks")

# Plot a box plot using the ticks style
plt.boxplot(y)
plt.title("Box Plot with Ticks Style")
plt.show()
输出

1K+ 阅读量
