
 数据结构
数据结构 网络
网络 关系数据库管理系统 (RDBMS)
 操作系统
操作系统 Java
Java iOS
iOS HTML
HTML CSS
CSS Android
 Python
 C 编程
C 编程 C++
C++ C#
C# MongoDB
 MySQL
MySQL Javascript
 PHP
PHPMATLAB 中的三次样条数据插值
在数学中,三次样条数据插值是一种计算给定数据集数据点之间值的方法。当我们想要绘制一条穿过这些数据点的平滑曲线时,这种技术被广泛使用。
在 MATLAB 中,我们可以使用两个内置函数中的任何一个来计算三次样条数据插值,即 'spline' 或 'interp1'。
语法
其中,'spline' 函数的语法为:
I = spline(x, y, query);
这里,'x' 和 'y' 是包含用于插值的输入数据点的向量,而 'query' 是包含我们要执行插值的数据点的向量。
'interp1' 函数的语法为:
I = interp1(x, y, query, 'spline');
在 'interp1' 函数中,我们使用 'spline' 选项来指定要对输入数据执行的操作。
如何使用 MATLAB 执行三次样条数据插值?
这里解释了对给定数据集点执行三次样条数据插值的逐步过程。
步骤 (1) - 定义要执行插值的数据点。
步骤 (2) - 指定包含我们要执行三次样条插值的数据点的查询。
步骤 (3) - 计算提供的输入数据点的三次样条数据插值。
步骤 (4) - 显示插值结果。
步骤 (5) - 绘制三次样条数据插值的结果。
现在让我们从实践上了解如何使用 MATLAB 计算三次样条数据插值。
以下 MATLAB 程序演示了对一组给定数据点进行三次样条插值的计算。
(1). 使用 'spline' 函数进行三次样条插值
以下 MATLAB 程序显示了如何使用 'spline' 函数来计算给定数据的三次样条插值。
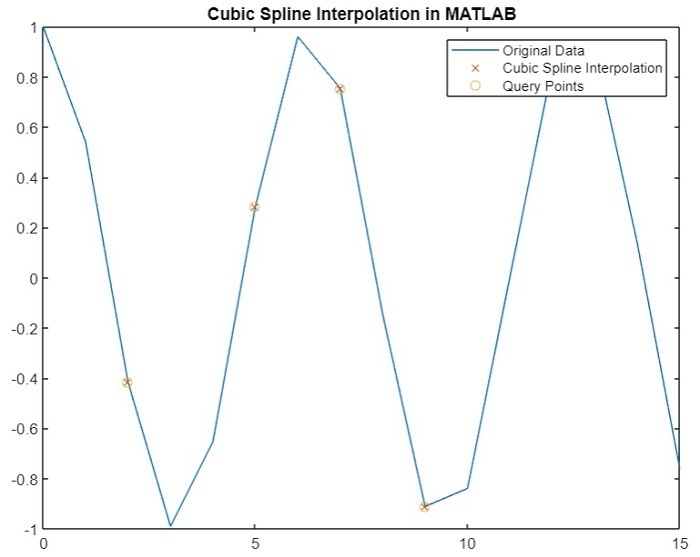
MATLAB 程序 (1)
% MATLAB program to calculate cubic spline data interpolation using 'spline' function
% Define sample data points
x = 0:15;
y = cos(x);

% Specify the query containing the data points to perform interpolation
query = [2, 5, 7, 9];

% Calculate the cubic spline interpolation
I = spline(x, y, query);

% Display the results of interpolation
disp('Query Points   Interpolation Results');
disp([query' I']);

% Plot curves for original data and interpolated results
figure;
plot(x, y, '-', query, I, 'x', query, I, 'o');
title('Cubic Spline Interpolation in MATLAB');
输出
Query Points   Interpolation Results
    2.0000   -0.4161
    5.0000    0.2837
    7.0000    0.7539
    9.0000   -0.9111
您将获得以下图 -
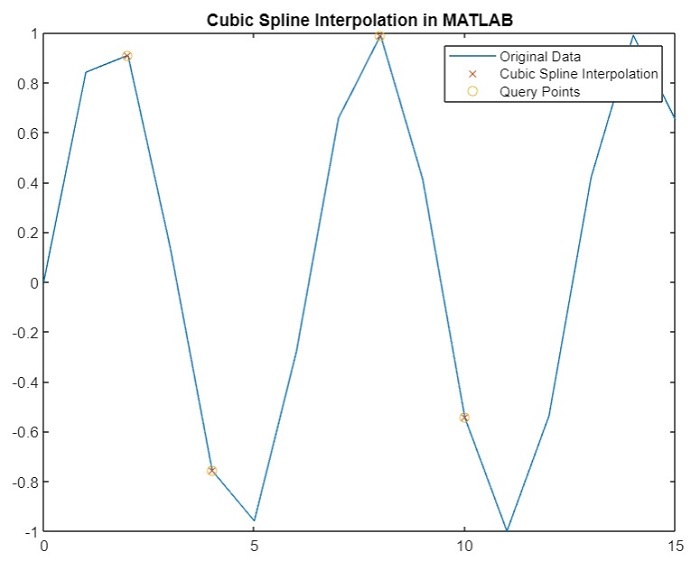
(2). 使用 'interp1' 函数进行三次样条插值
如上所述,我们还可以使用 'interp1' 函数计算给定数据集的三次样条插值。以下 MATLAB 程序说明了使用 'interp1' 函数计算三次样条插值的代码实现。
Matlab 示例 (2)
% MATLAB program to calculate cubic spline data interpolation using 'interp1' function
% Define sample data points
x = 0:15;
y = sin(x);

% Specify the query containing the data points to perform interpolation
query = [2, 4, 8, 10];

% Calculate the cubic spline interpolation
I = interp1(x, y, query, 'spline');

% Display the results of interpolation
disp('Query Points   Interpolation Results');
disp([query' I']);

% Plot curves for original data and interpolated results
figure;
plot(x, y, '-', query, I, 'x', query, I, 'o');
legend('Original Data', 'Cubic Spline Interpolation', 'Query Points');
title('Cubic Spline Interpolation in MATLAB');
输出
Query Points   Interpolation Results
    2.0000    0.9093
    4.0000   -0.7568
    8.0000    0.9894
   10.0000   -0.5440
您将获得以下图 -
结论
这就是关于使用 MATLAB 计算三次样条数据插值的所有内容。在本教程中,我们描述了三次样条数据插值以及使用 MATLAB 计算它的步骤。此外,我们还通过示例 MATLAB 程序演示了使用 MATLAB 计算三次样条数据插值,以便更好地理解。

269 次查看
