
 数据结构
数据结构 网络
网络 关系型数据库管理系统
 操作系统
操作系统 Java
Java iOS
iOS HTML
HTML CSS
CSS Android
 Python
 C 编程
C 编程 C++
C++ C#
C# MongoDB
 MySQL
MySQL Javascript
 PHP
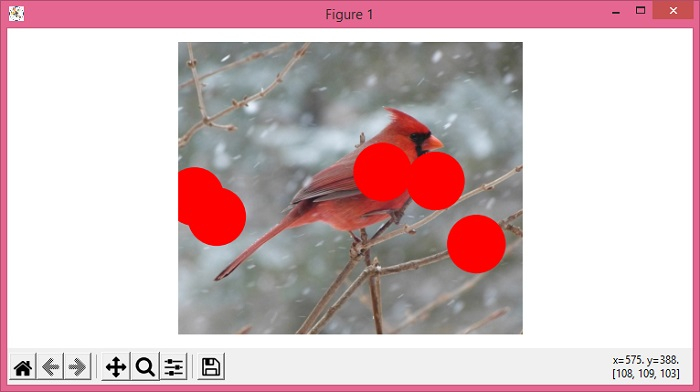
PHP使用 Matplotlib 和 NumPy 在图像上绘制圆
要使用 matplotlib 和 numpy 在图像上绘制圆,我们可以执行以下步骤:
设置图形大小并调整子图之间和周围的填充。
从文件中读取图像到一个数组中。
使用 numpy 创建 x 和 y 数据点。
使用 subplots() 方法创建图形和一组子图。
以图像形式显示数据,即在二维规则光栅上使用 imshow() 方法。
关闭坐标轴。
在当前坐标轴上添加补丁。
要显示图形,请使用 show() 方法。
示例
import matplotlib.pyplot as plt
import numpy as np
from matplotlib.patches import Circle

plt.rcParams["figure.figsize"] = [7.50, 3.50]
plt.rcParams["figure.autolayout"] = True

img = plt.imread('bird.jpg')

x = np.random.rand(5) * img.shape[1]
y = np.random.rand(5) * img.shape[0]

fig, ax = plt.subplots(1)
ax.imshow(img)
ax.axis('off')

for xx, yy in zip(x, y):
   circ = Circle((xx, yy), 50, color='red')
   ax.add_patch(circ)

plt.show()
输出

更新日期:04-6 月-2021
2K+ 查看次数

广告