
 数据结构
数据结构 网络
网络 RDBMS
RDBMS 操作系统
操作系统 Java
Java iOS
iOS HTML
HTML CSS
CSS Android
 Python
 C 编程
C 编程 C++
C++ C#
C# MongoDB
 MySQL
MySQL Javascript
 PHP
PHP如何在 Matplotlib 中获取轴上单一单位长度?
要在 Matplotlib 中获取轴上单一单位长度,我们可以执行以下步骤 -
- 设置图像尺寸并调整子图之间和周围的填充。
- 使用 numpy 创建x 和 y 数据点。
- 使用figure() 方法创建新图像或激活现有图像。
- 将'~.axes.Axes' 作为子图排列的一部分添加到图像中。
- 使用plot() 方法绘制x 和 y 数据点。
- 要获取单一单位长度,请使用transData 转换。
- 打印水平和垂直长度。
- 要显示图形,请使用show() 方法。
示例
import numpy as np
import matplotlib.pyplot as plt

plt.rcParams["figure.figsize"] = [7.50, 3.50]
plt.rcParams["figure.autolayout"] = True

x = np.arange(0, 10, 0.005)
y = np.exp(-x / 2.) * np.sin(2 * np.pi * x)

fig = plt.figure()

ax = fig.add_subplot(111)
ax.plot(x, y)

xy = ax.transData.transform([(0, 1), (1, 0)])\
    -ax.transData.transform((0, 0))

print("Vertical length:", xy[0][1])
print("Horizontal length: ", xy[1][0])

plt.show()
输出
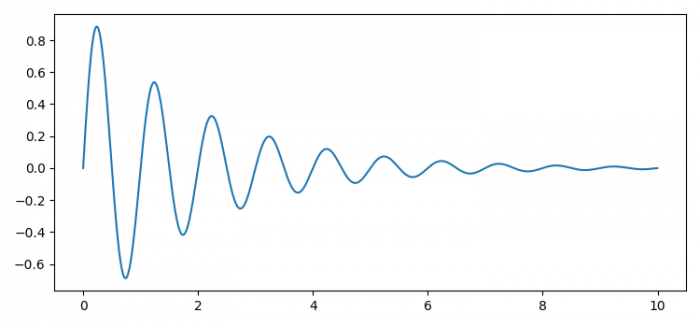
除了图表,我们还将在控制台上获得以下输出 -
Vertical length: 269.5
Horizontal length: 581.25

更新于:2021 年 7 月 7 日
375 次浏览

广告